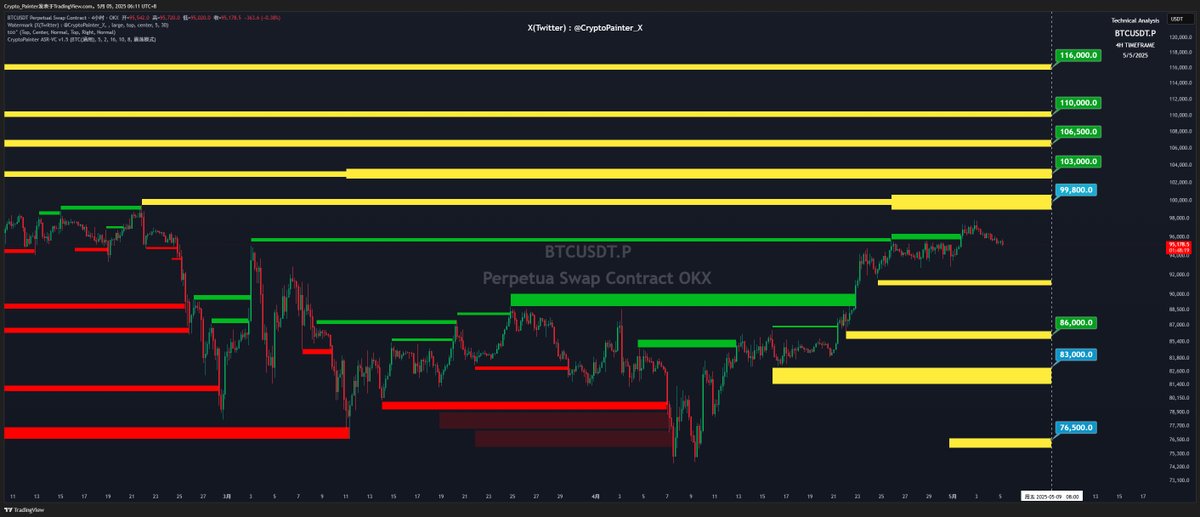
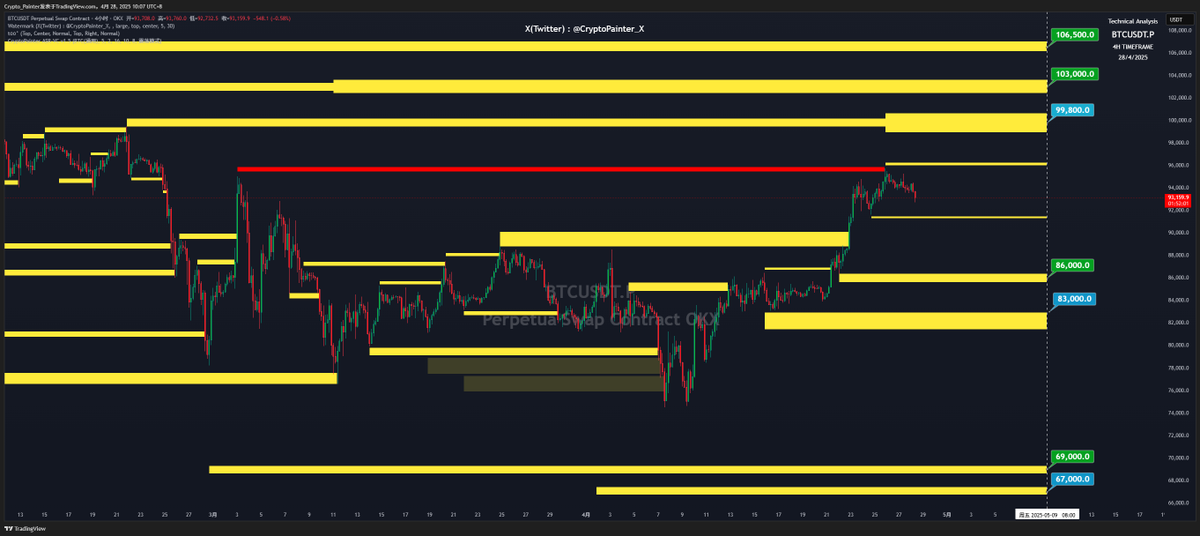
Today, we have upgraded the historical liquidation map of BTC, with yellow for unliquidated areas, and green and red for historical areas that have been liquidated;
It intuitively shows the liquidation record of the futures market in the last 2 months, and it is interesting to note that the decline during the tariff war is indeed the bottom after the long liquidity is cleared...
This is not to say that the dog village is deliberate, but the liquidity itself is a price magnet;
From this point of view, the price is not intended to liquidate the price of a position, but when there is a large amount of futures liquidity in a position, it will spontaneously suck the price over;
Imagine that you open an order in the wrong direction in a certain position, and then the price moves in the opposite direction, if people who do the same thing in the wrong direction like you will liquidate their positions in a certain range, then as the price continues to get closer to that liquidation position, there will always be people who can't help but close their positions early...
The act of closing the position brings more forward momentum to the price, so it triggers more people to close the position and stop loss, forming a cycle, until the price enters the area where everyone has to close the position, that is, the liquidation area, and the position that you also do in the wrong direction should be closed, and the explosion should be exploded...
As a result, the price has lost its previous momentum, and it will naturally bottom out or peak...
Therefore, it is not the price that is looking for the liquidation area to liquidate, but the liquidation area itself is attracting the price!
In this process, the buying and selling behavior of the spot market is the fuse, while the behavior of the futures market is a passively triggered chain reaction.
So can it be concluded that in a market like BTC, most of the time it is futures who participate in the game, and they will accumulate liquidity up and down the price range, which is the time to prepare for the next trend;
However, the price of this process will not go out of the obvious direction, until the spot market finally appears strong supply or demand, forcibly changing the balance of the futures market, so the chain reaction appears, the price begins to break out of the market, and then open a round of trend market, until the liquidity in this direction is liquidated;
So how does this explain that sometimes the price is about to enter the liquidation zone, but there is no liquidation, so it turns around and goes back?
In fact, the logic is still the same, liquidation liquidity is itself consuming its own energy in the process of attracting prices, so if the market sentiment has obvious overdraft or the price has not seen an effective rebound or pullback for a long time, then only a little bit of supply or demand in the spot market, the price may not complete the complete liquidation and turn around;
The liquidity in the liquidation area will only show the opening record, not the closing record, which we cannot quantify!
On the other hand, the sudden supply and demand in the spot market are often affected by external events, U.S. stocks and news, which creates the illusion that news affects prices...
Therefore, the main thing that really maintains the trend is the accumulated futures liquidity, and the spot only needs to make a simple breakthrough or rejection at the end of the shock range regardless of the size level!

In addition to the liquidity map on the data website, you can also pay attention to the historical chart of the futures clearing area of the whole network that is updated on time every Monday;
The difference between the two: The online clearing map cannot mark the liquidity intensive areas in the past few months, because when there is a liquidity area with higher liquidation intensity, the liquidation area that also has reference value will be weakened...
But I can manually mark out the key areas of the week and refer to them for the long term!
For example, the recent rally just liquidated the short liquidity liquidation zone (red rectangle in the figure) that I marked out 2 months ago, and if we only stare at the current real-time liquidation map, we will not be able to obtain the long-term liquidity data here;
That's why I spend a lot of time manually mapping this historical reckoning;
Returning to the current market, the blue price tag in the chart represents the area where there is new liquidity, and it is obvious that it can be seen that the liquidation price of the new positions of the shorts is already close to the 99800 area of 10w, while the liquidation price of the new positions of the bulls is still around 83000;
Although the short-term long-short leverage ratio mentioned in the quotation tends to be balanced, the long-term long-short leverage ratio is still slightly higher for shorts;
This may be the main reason why "although the price looks like it needs to pull back, there is always a feeling of not moving";
My thinking is that in the past two weeks, due to the end of the tariff war, the market has entered a "refractory period" for "external events" in the short term, so the futures liquidation market has become the main driving force for price changes;
And going into this week, the situation has changed significantly:
On Tuesday there was a development of events regarding the BTC strategic reserve;
Wednesday has a whole bunch of macro data released...
This week is likely to return to an "event-driven" market atmosphere.
Therefore, it is recommended that you pay attention to control your position, the direction cannot be judged, and adapt to the market from the perspective of reducing the risk of drawdown!
In a word~ can't be patterned!
#OKX

113.95K
190
The content on this page is provided by third parties. Unless otherwise stated, OKX is not the author of the cited article(s) and does not claim any copyright in the materials. The content is provided for informational purposes only and does not represent the views of OKX. It is not intended to be an endorsement of any kind and should not be considered investment advice or a solicitation to buy or sell digital assets. To the extent generative AI is utilized to provide summaries or other information, such AI generated content may be inaccurate or inconsistent. Please read the linked article for more details and information. OKX is not responsible for content hosted on third party sites. Digital asset holdings, including stablecoins and NFTs, involve a high degree of risk and can fluctuate greatly. You should carefully consider whether trading or holding digital assets is suitable for you in light of your financial condition.

