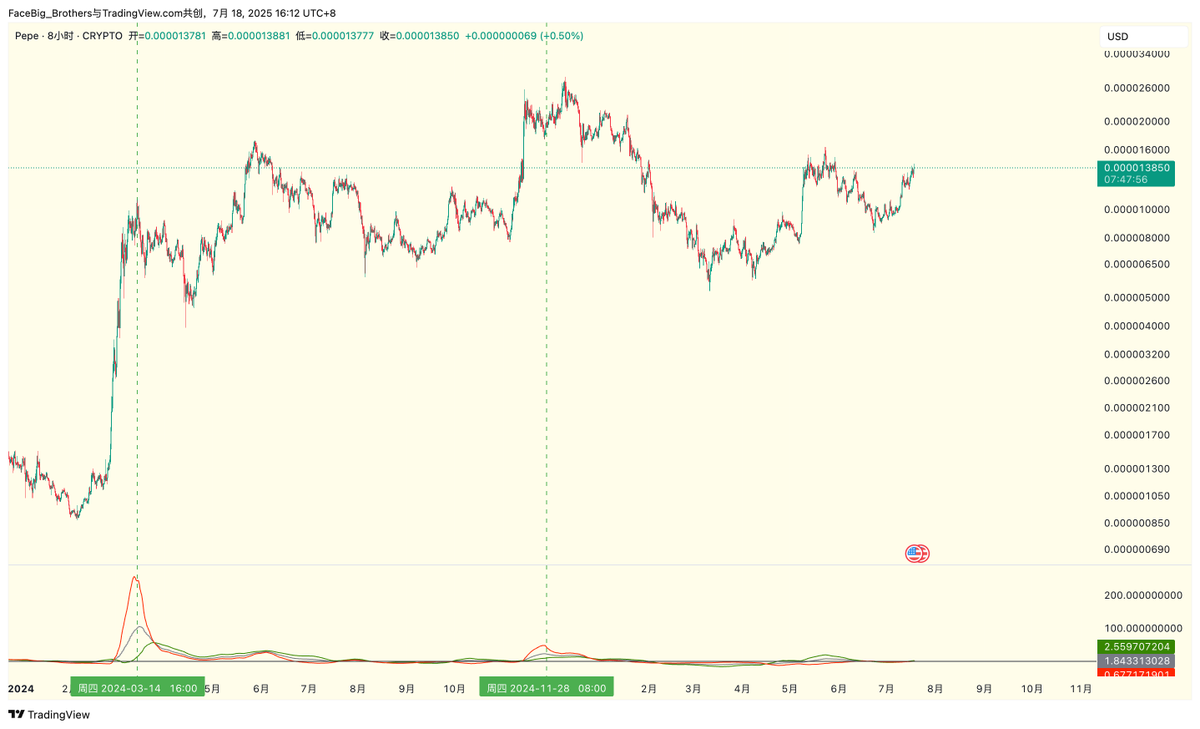
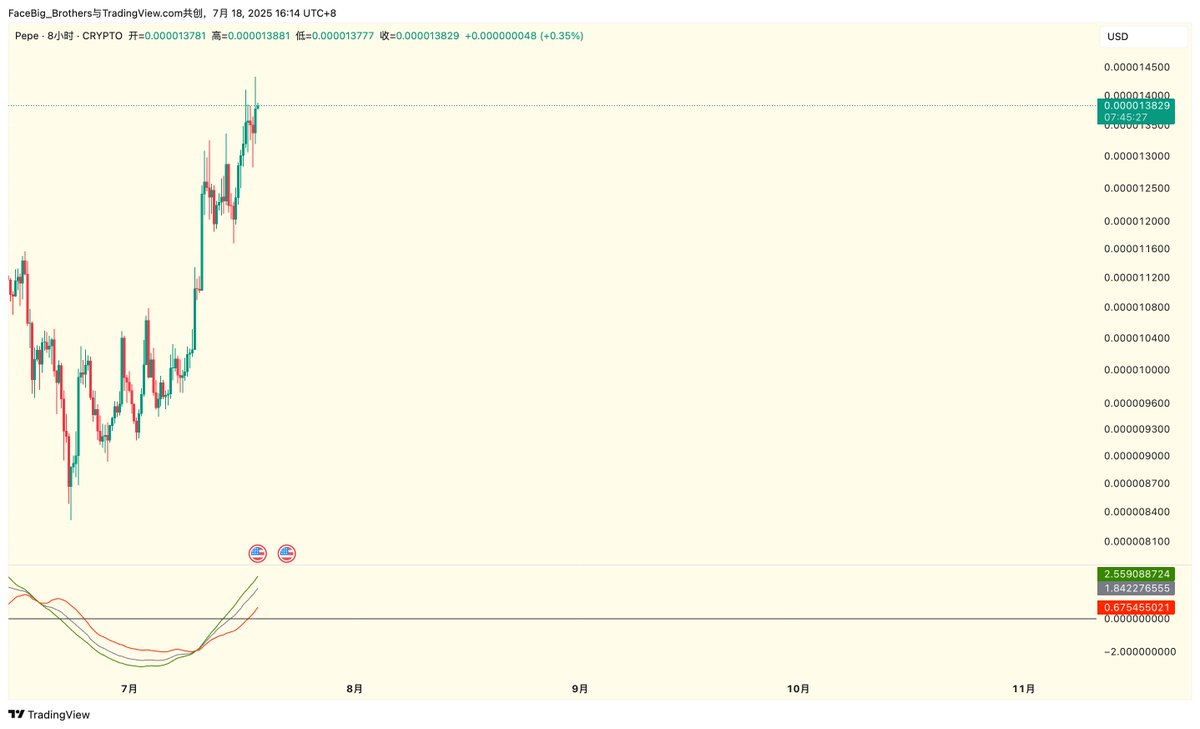
Using the weighted sell indicator of rainbow candy to take a look at the $PEPE on the 8H level, the red line has just crossed the zero axis (Figure 2 is an enlargement);
Still early.


The weighted sell indicator of Rainbow Candy is one of the most important segment visualization systems in my trading visualization system: it is used to signal sell opportunities, and it is 100 times more accurate than the Wyckoff boys on Twitter;
When the red curve turns downward, it clearly indicates a local top;
Let’s casually take three examples of $pepe on the 4H chart;
The green line in the last image represents the current situation, while the red line hasn't even crossed the zero axis and has just turned;
A healthy accumulation is rising;
Still early.


25.51K
14
The content on this page is provided by third parties. Unless otherwise stated, OKX is not the author of the cited article(s) and does not claim any copyright in the materials. The content is provided for informational purposes only and does not represent the views of OKX. It is not intended to be an endorsement of any kind and should not be considered investment advice or a solicitation to buy or sell digital assets. To the extent generative AI is utilized to provide summaries or other information, such AI generated content may be inaccurate or inconsistent. Please read the linked article for more details and information. OKX is not responsible for content hosted on third party sites. Digital asset holdings, including stablecoins and NFTs, involve a high degree of risk and can fluctuate greatly. You should carefully consider whether trading or holding digital assets is suitable for you in light of your financial condition.

