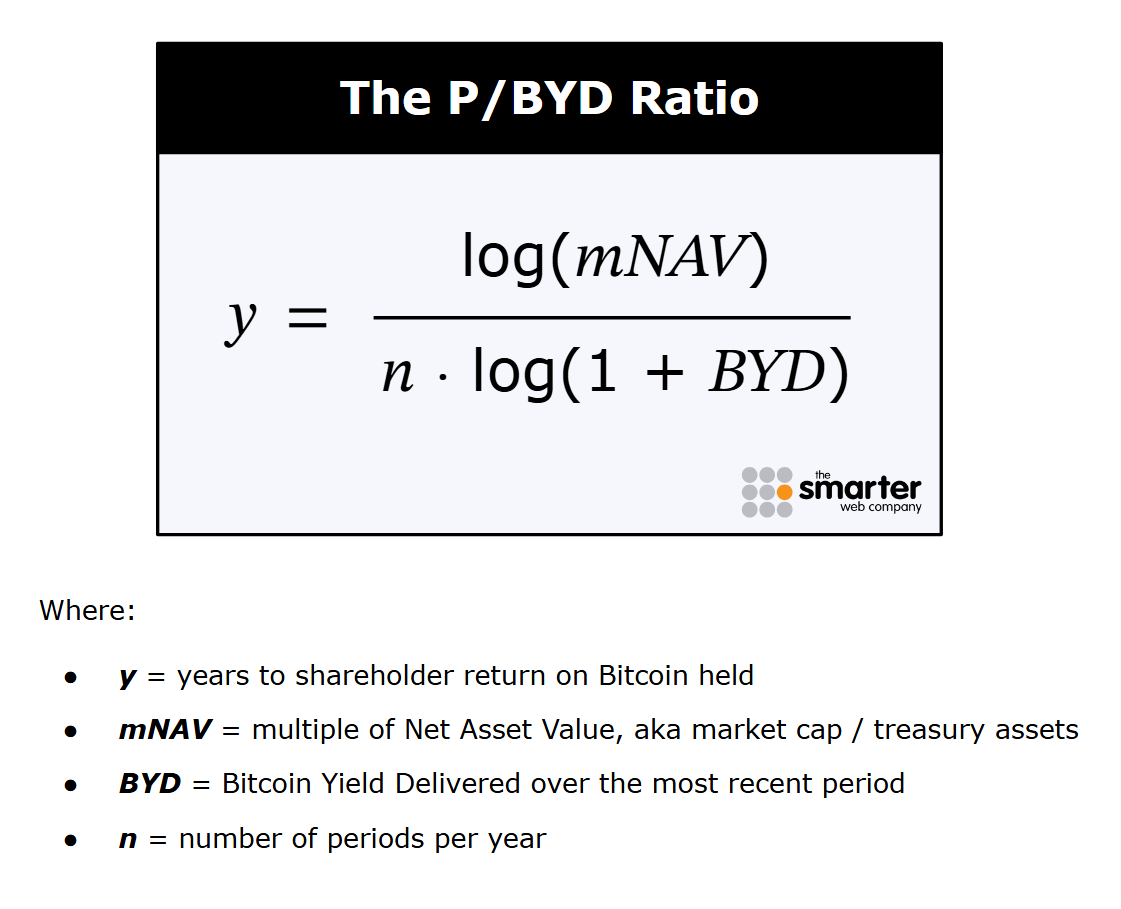
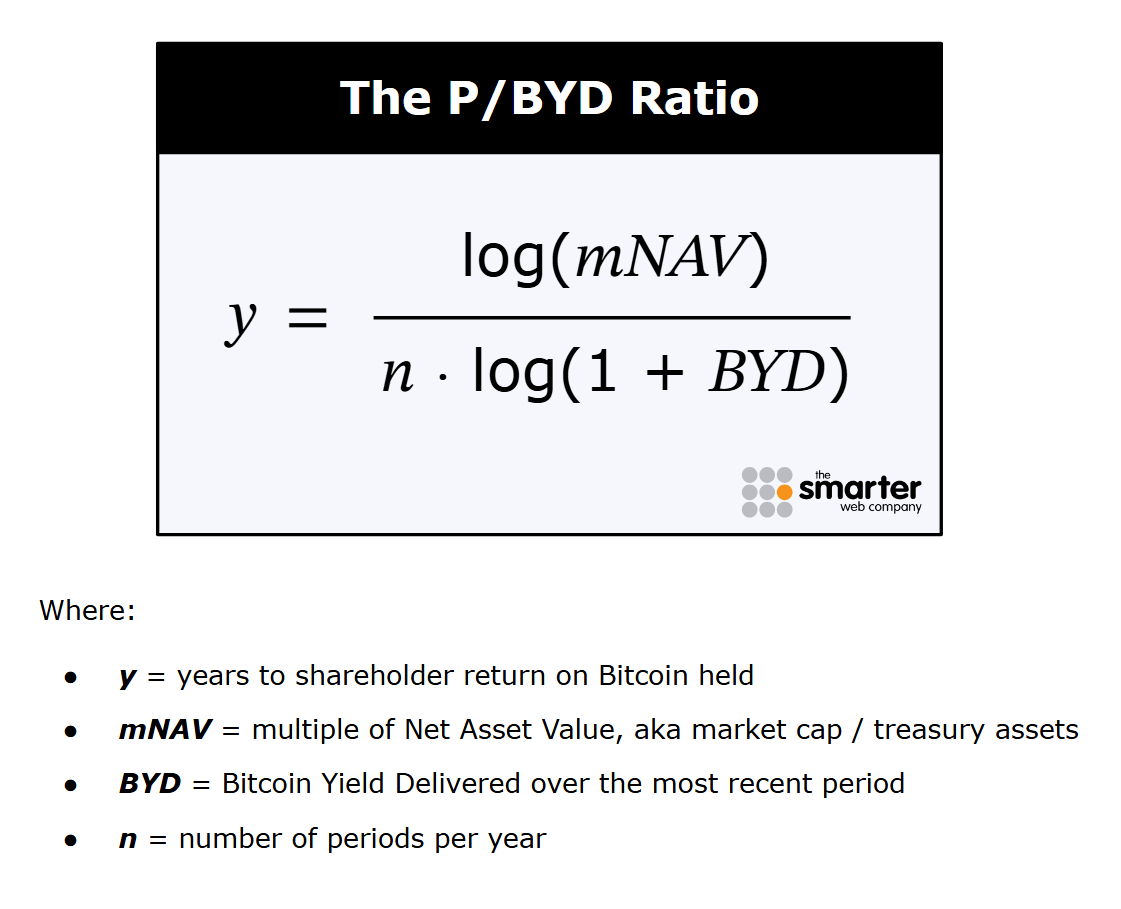
The P/E ratio for Bitcoin treasury companies: P/BYD
Price / Bitcoin Yield Delivered (we've been calling it "p-bid") represents a valuable new metric for #Bitcoin treasury company analysis.
THREAD on how it works & what it reveals about traditional equities...

To date, BTCTC analysis has used two key metrics:
• mNAV: market cap / treasury value
• Days to Cover: how many days ago did BTC Per Share = current BPS / mNAV
Each tells half of the full story (market premium & recent rate of performance). P/BYD incorporates both.
In traditional equities analysis, the P/E ratio is a valuable shorthand for how many years it will take to earn back your investment via income statement profits.
By contrast, BTCTCs deliver value via the balance sheet, by growing Bitcoin Per Share (aka, delivering BTC Yield).
If we wanted to create a metric for BTCTCs to isolate the number of years that it could take to deliver enough BTC Yield to offset the mNAV premium paid up front, what would that look like?
In other words, what would be the BTCTC equivalent to a P/E ratio?
Introducing P/BYD...

P/BYD (aka "p-bid") is most similar to Days to Cover, but improves on it in a couple of ways:
• Returns output in years (like a P/E ratio)
• Allows the user to define a sample period of recent performance to project forward, rather than simply looking back in time as far as necessary
264.66K
1.47K
The content on this page is provided by third parties. Unless otherwise stated, OKX is not the author of the cited article(s) and does not claim any copyright in the materials. The content is provided for informational purposes only and does not represent the views of OKX. It is not intended to be an endorsement of any kind and should not be considered investment advice or a solicitation to buy or sell digital assets. To the extent generative AI is utilized to provide summaries or other information, such AI generated content may be inaccurate or inconsistent. Please read the linked article for more details and information. OKX is not responsible for content hosted on third party sites. Digital asset holdings, including stablecoins and NFTs, involve a high degree of risk and can fluctuate greatly. You should carefully consider whether trading or holding digital assets is suitable for you in light of your financial condition.

