Even if going long on $BTC is already politically correct,
Even if the four-year cycle has likely been broken,
Even if it might still rise again,
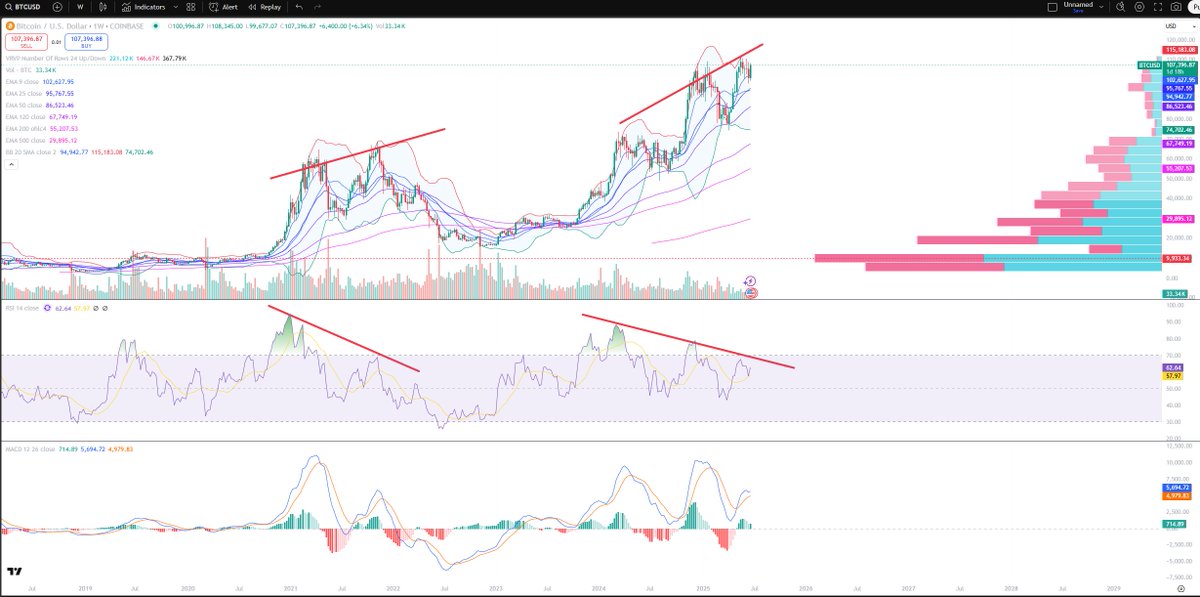
The weekly RSI showing repeated bearish divergence
is still worth paying attention to.

Identifying turning points in long cycles is much more meaningful than discussing how long the bull market can last and the exit prices for $BTC and $ETH. Although the methods for judging turning points may vary, there is only one truth to verify, which is to be able to confirm it on the candlestick chart. If your judgment of the turning point is too early or too late compared to the market, you will suffer losses. Personally, I believe the most effective verification methods, or even indicators that can be directly used to judge turning points, are: 1) RSI divergence; 2) Moving average arrangement.
TLDR: Whether it's $BTC or $ETH, although the weekly RSI has been in the overbought zone for a while (which is common in bull markets), there has not been a single instance of a meaningful weekly divergence. The daily and weekly moving averages are also in a bullish arrangement, showing no signs of reversal. Most prices and trades are operating above the short-term moving averages, and the pullbacks have not touched the long-term moving averages; even the 100-day moving average on the daily chart has not been broken. Clearly, the market still has a distance to go before reaching its peak. Although it will certainly experience fluctuations and pullbacks, this is not important. What matters is whether you can abandon preconceived notions and expectations of target prices when the real turning point arrives and acknowledge the objective facts.
Now let's talk about RSI and moving averages:
1) RSI Divergence
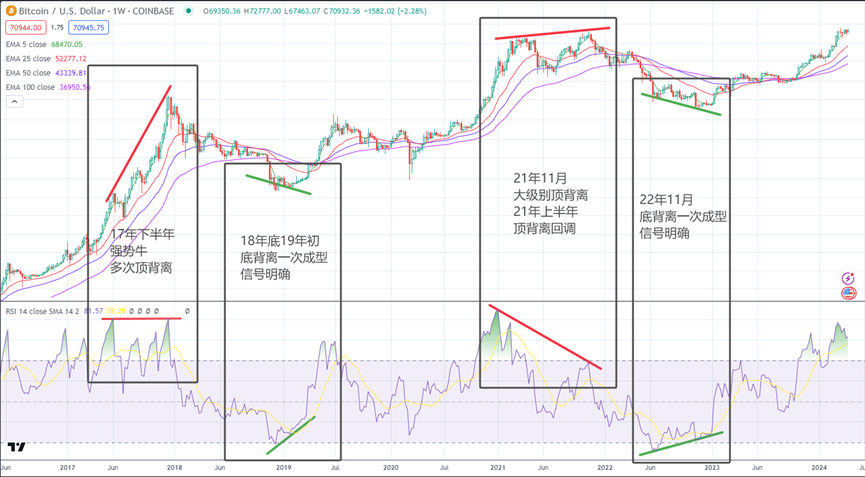
This mainly refers to the phenomenon where the price reaches a new high, but the RSI does not reach a new high or even shows a downward trend, known as "top divergence"; or when the price reaches a new low, but the RSI does not reach a new low or even shows an upward trend, known as "bottom divergence."
The characteristic of this indicator is that it "leads" the market; often when the signal appears, the price has not yet reflected it, and many times the price continues to rise or fall. However, the power of this indicator lies in the fact that the longer the divergence lasts and the more times it occurs, the stronger the reversal signal.
In terms of long cycles, weekly RSI divergence is more meaningful because this signal appears relatively infrequently, usually only 1-2 times, thus causing less interference, while daily RSI divergence occurs more frequently, often corresponding to short-term pullbacks rather than reversals. Taking BTC as an example:
In practice, it is often found that the number of times top divergence occurs in a cycle is often more than once, and there have been instances of repeated divergences in the past, while bottom divergence usually forms in one go. I personally speculate that this has a close relationship with human greed and fear: during top divergence, even if the market shows signs of excessive buying, participants generally hold an optimistic attitude and may ignore risks, thus continuing to push prices higher. Conversely, during the formation of the bottom, due to widespread pessimism in the market, investors tend to act conservatively or completely lie flat, which reduces market activity and gives smart money the opportunity to intervene and drive reversals, making it easier to form in one go. However, as market funds become more mature and rational, the occurrence of repeated top divergences will decrease, so this indicator remains a core reference for verifying long cycle turning points.
2) Moving Average Arrangement
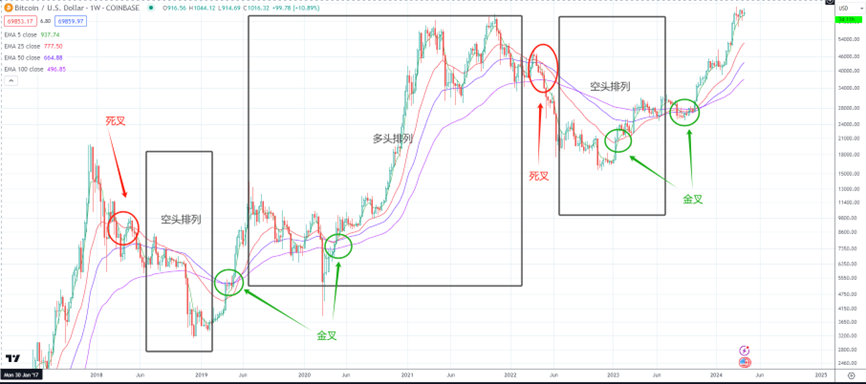
This mainly refers to the phenomenon where the short-term moving average (5-day moving average) is above the medium-term moving averages (25-day and 50-day moving averages), and the medium-term moving averages are also above the long-term moving averages (100-day and 200-day moving averages), which is called a "bullish arrangement"; or when the short-term moving average (5-day moving average) is below the medium-term moving averages (25-day and 50-day moving averages), and the medium-term moving averages are also below the long-term moving averages (100-day and 200-day moving averages), which is called a "bearish arrangement."
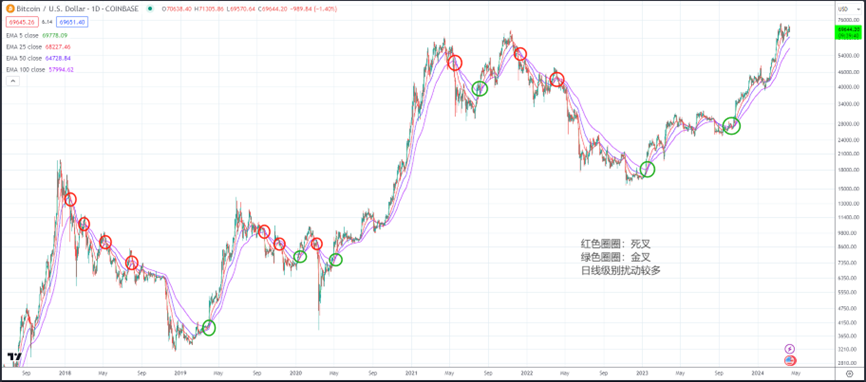
The characteristic of this indicator is that it is "lagging" behind the market; often when a bearish arrangement turns into a bullish arrangement, or a bullish arrangement turns into a bearish arrangement, the top or bottom has already passed for some time. Therefore, we pay more attention to the turning points where the arrangement pattern may begin to change, which are often described using "golden crosses" or "death crosses." A "golden cross" occurs when the short-term moving average crosses above the medium to long-term moving averages, while a "death cross" occurs when the short-term moving average crosses below the medium to long-term moving averages.
Due to the "lagging" nature of moving average patterns, it is recommended to use weekly and daily charts to mutually assist in verification. Again, taking BTC as an example:
In practice, it is found that our market is characterized by long bull markets and short bear markets; in reality, there are only a few months where a complete bearish arrangement forms and continues to decline. Additionally, although "golden crosses" and "death crosses" will appear before the confirmation of moving average patterns, they occur relatively more frequently and cause more disturbances. However, these disturbances correspond to the repeated battles between bullish and bearish forces, as well as multiple selling and buying points in the bull and bear cycles. It is impossible to accurately hit the top and bottom, so it is better to try a few more times.


9.9K
4
The content on this page is provided by third parties. Unless otherwise stated, OKX is not the author of the cited article(s) and does not claim any copyright in the materials. The content is provided for informational purposes only and does not represent the views of OKX. It is not intended to be an endorsement of any kind and should not be considered investment advice or a solicitation to buy or sell digital assets. To the extent generative AI is utilized to provide summaries or other information, such AI generated content may be inaccurate or inconsistent. Please read the linked article for more details and information. OKX is not responsible for content hosted on third party sites. Digital asset holdings, including stablecoins and NFTs, involve a high degree of risk and can fluctuate greatly. You should carefully consider whether trading or holding digital assets is suitable for you in light of your financial condition.

