This old L1---- @NEARProtocol latest progress analysis:
Product and ecosystem upgrades
The "Chain Signatures" feature supports a wide network.
The Chain Signatures functionality of @NEARProtocol (which allows transactions on chains like BTC, ETH, DOGE, XRP to be signed through NEAR accounts) is now live, and in the future, it will support Solana and TON, significantly enhancing cross-chain interoperability and increasing application attractiveness.
Node Studio promotes validator diversification.
Since July, NEAR and Meta Pool have launched Node Studio, a no-code platform that helps deploy validator nodes more easily, aiming to strengthen network decentralization and female participation.
Technical vision
Positioned as an AI-native Layer-1.
The official continues to emphasize that @NEARProtocol is designed for AI-driven applications, including modular SDKs, intent-driven transaction processes, and dynamic sharding to support high concurrency and fast block production.
Finally
@NEARProtocol's positioning as the underlying platform for AI-native applications is becoming clearer, but attention must still be paid to potential situations arising from technical execution and market fluctuations.
It is recommended to pay attention to the following key events:
1. The specific inflow situation of Bitwise NEAR Staking ETP in Europe;
2. The voting approval and actual execution of inflation rate adjustments;
3. The expansion of Node Studio validators and the process of network decentralization;
4. Feedback on the practicality of Chain Signatures for multi-chain ecosystems.
If there are discrepancies, feel free to supplement and correct, thank you all 😁
$BTC has reached a new high again. I wonder if interest rates will really drop in July; otherwise, how can it keep hitting new highs? The surge in the early morning was quite strong. Or maybe not many people are selling, and it's just the liquidity for shorting that pushed it up. I'll continue to observe. @NEARProtocol
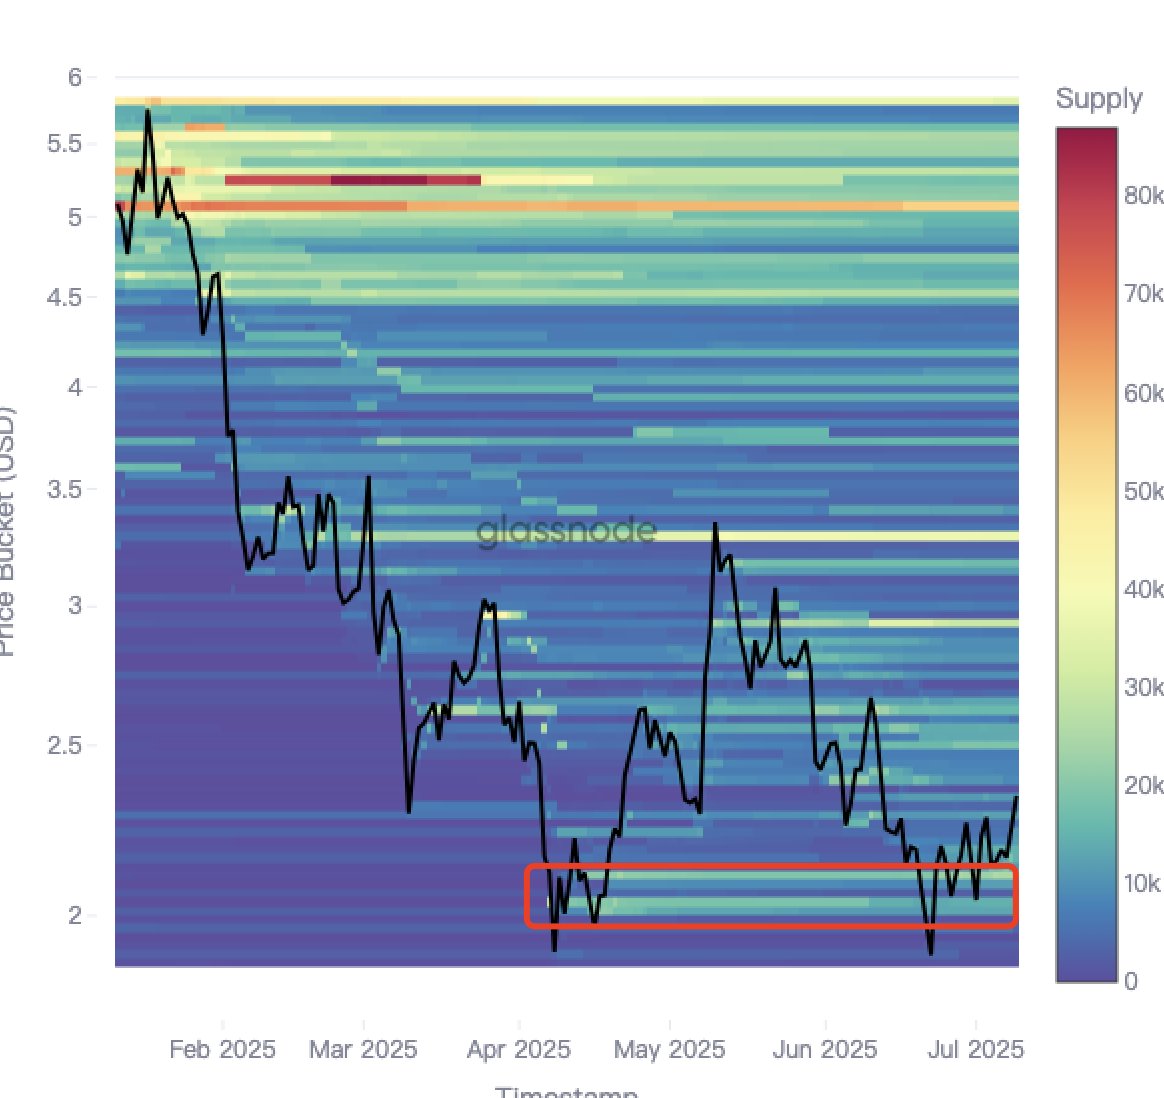
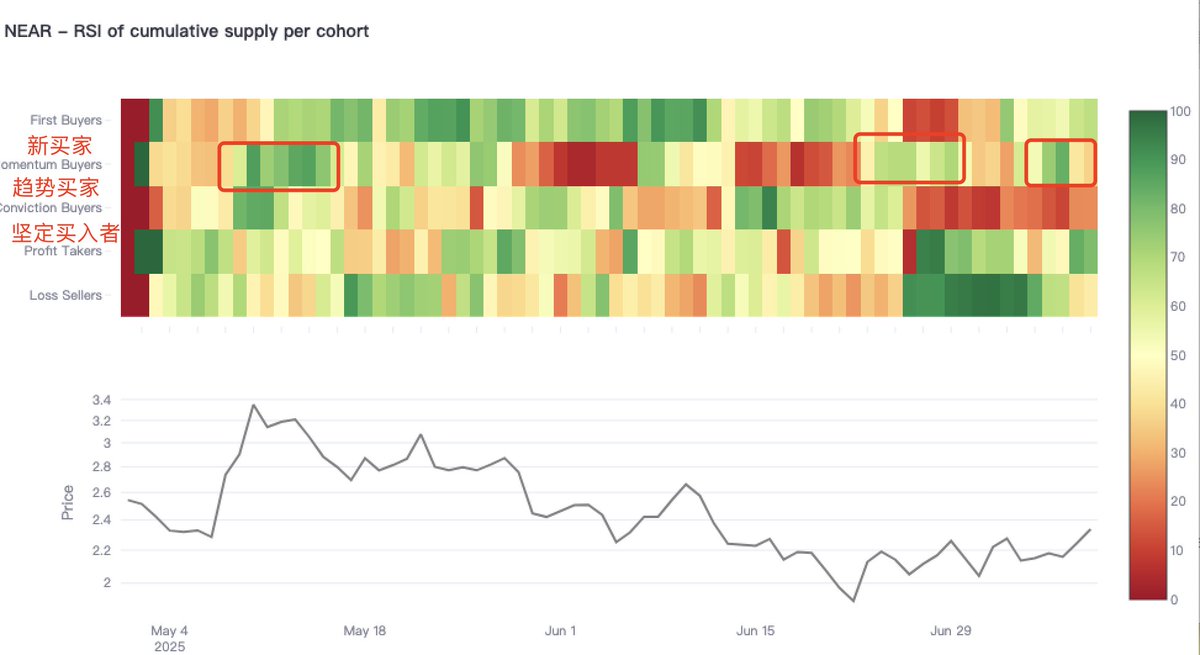
Here's an update on the CBD and RSI data for @NEARProtocol, as shown in the image.
The Cost Basis Distribution (CBD) heatmap visually presents the supply density at different price levels over a specific time period.
After selecting a time range, this indicator will display a heatmap where the y-axis represents the logarithmic scale of the cost basis, set from 1% below the lowest price to 1% above the highest price during the selected period. The color intensity of each pixel reflects the concentration of supply at that price level, allowing investors to identify where significant portions of asset supply come from.
I have previously provided detailed explanations for both of these charts. You can check my earlier tweets for more information.
Looking at a longer time frame, it follows the price fluctuations driven by BTC sentiment. However, if $BTC can maintain its high position this time, let's see if the trend momentum buyers for @NEARProtocol can continue.
Be cautious of FOMO, or it's just for everyone to learn. This is not investment advice.


23.76K
85
The content on this page is provided by third parties. Unless otherwise stated, OKX is not the author of the cited article(s) and does not claim any copyright in the materials. The content is provided for informational purposes only and does not represent the views of OKX. It is not intended to be an endorsement of any kind and should not be considered investment advice or a solicitation to buy or sell digital assets. To the extent generative AI is utilized to provide summaries or other information, such AI generated content may be inaccurate or inconsistent. Please read the linked article for more details and information. OKX is not responsible for content hosted on third party sites. Digital asset holdings, including stablecoins and NFTs, involve a high degree of risk and can fluctuate greatly. You should carefully consider whether trading or holding digital assets is suitable for you in light of your financial condition.

