“#Bitcoin has topped.”🚨
That’s what people say every time price slows down.
But here’s the reality:
Not one major market top indicator has triggered.
I went through all the TOP indicators.
Here’s what each of them says 🧵👇
1⃣ AHR999 Index
This measures how far Bitcoin’s price is from its long-term “fair value,” based on a combo of the 200-day MA and a DCA model.
The lower the number, the more undervalued $BTC is.
When it goes above 4, historically that’s a danger zone (2013/2017/2021).
• Current: 1.03
• Top zone: 4+
• Status: Nowhere near top
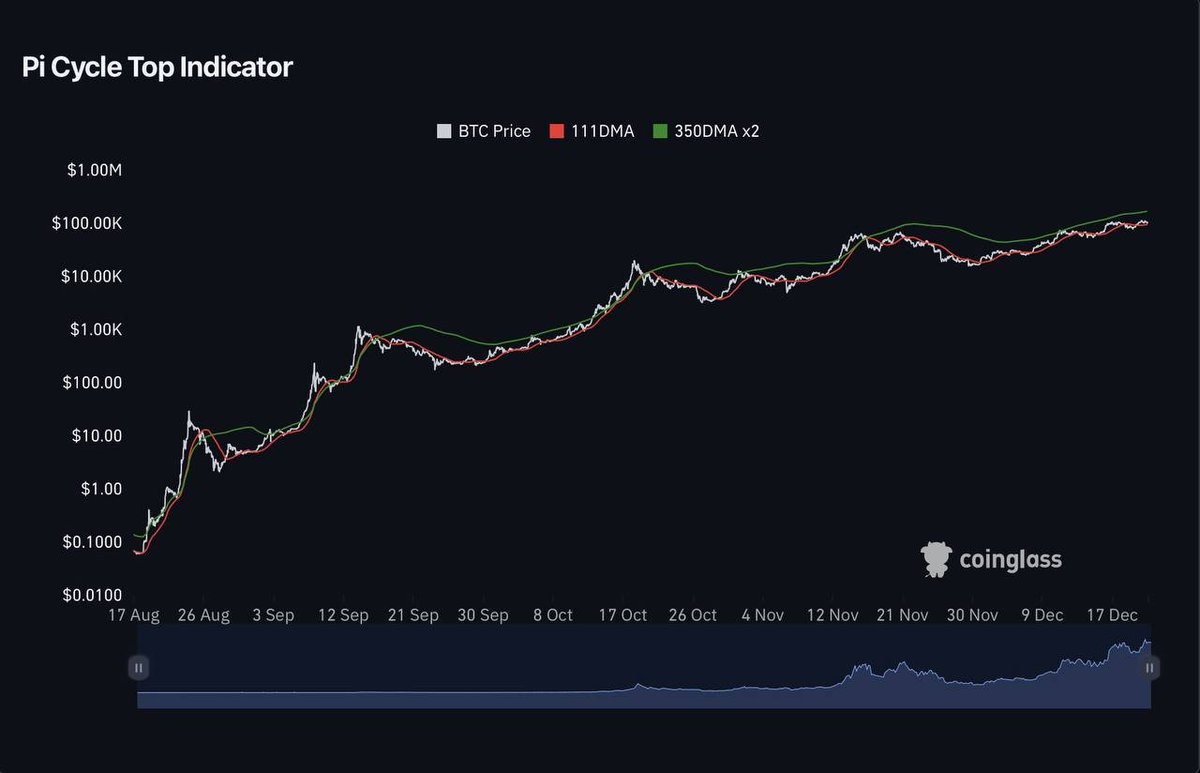
2⃣ Pi Cycle Top
Uses a crossover between two moving averages:
• 111-day MA
• 2× 350-day MA
Every time they crossed in the past → cycle top was in (to the day in 2013 & 2017).
• Current $BTC Price: $107k
• Estimated crossover at: $165K+
• Status: Still far from triggering
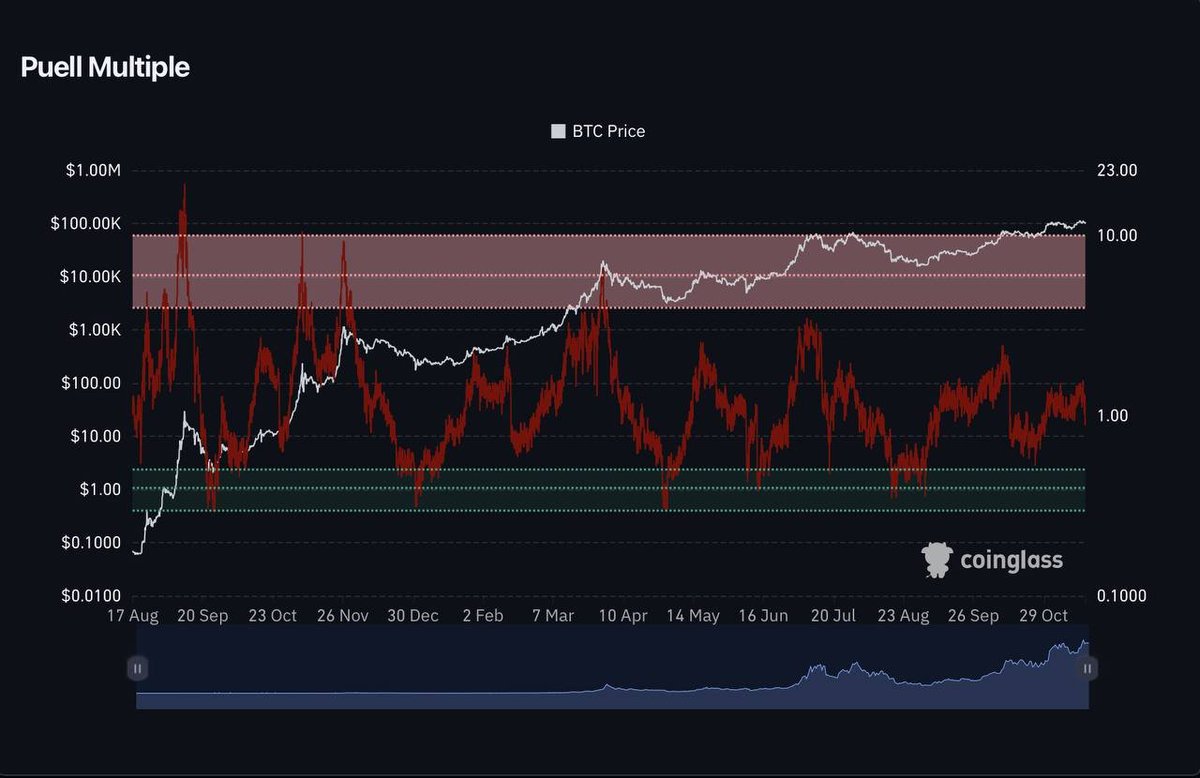
3⃣ Puell Multiple
This shows how much revenue #Bitcoin miners are making vs. their 365-day average.
If it gets too high, it means miners are making huge profits and might start selling.
• Current: 1.31
• Historical top zone: >2.2
• Status: Still in safe zone
Tops often come when miners start exiting in profit. That’s not happening yet.

4⃣ MVRV Z-Score
Compares #BTC’s current market cap to the average cost basis of all coins (realized cap), normalized with standard deviation.
It’s a top-tier metric for spotting overvaluation.
• Current Z-Score: 2.41
• Historical top zone: ≥5
• Status: Mid-range
We’re not in euphoria. Still in accumulation or mid-cycle territory.
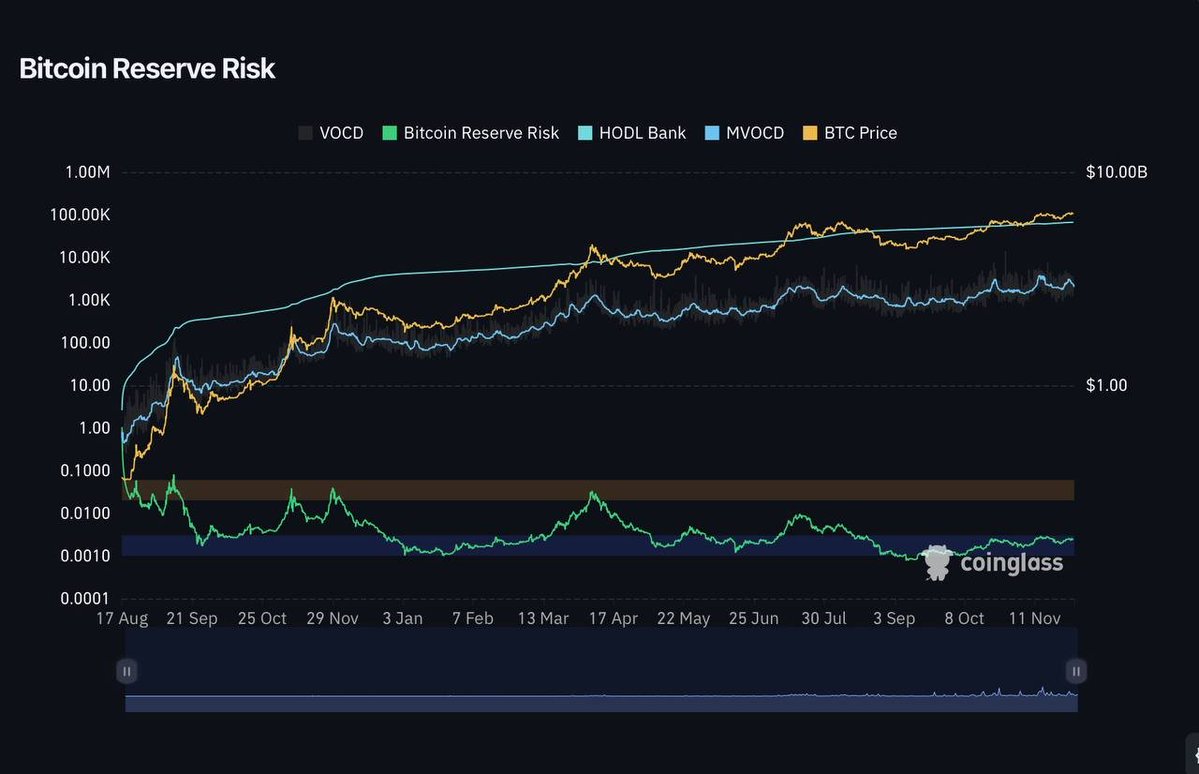
5⃣ Reserve Risk
It compares #BTC’s price to the confidence level of long-term holders (HODLers).
Higher values = price is too high relative to the conviction holding it up.
• Current: 0.0025
• Top risk zone: ≥0.005
• Status: HODLers still confident
No signs of long-term holders losing belief.

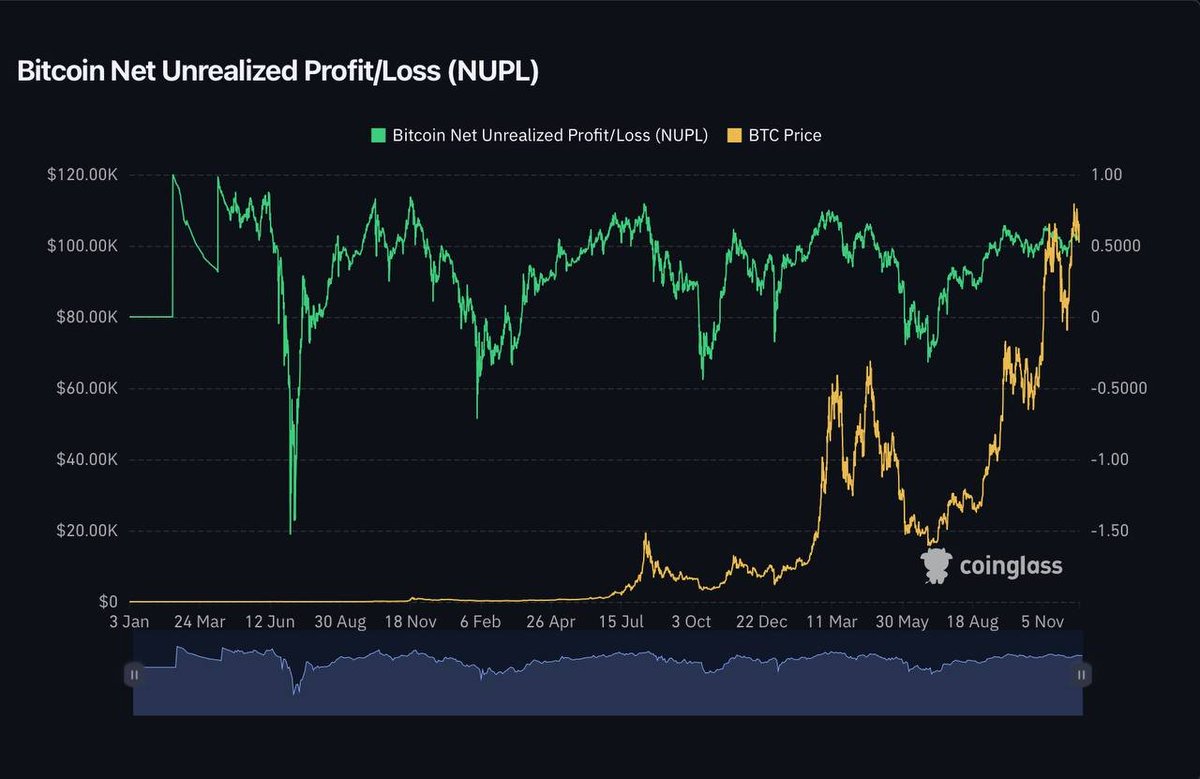
6⃣ Net Unrealized Profit/Loss (NUPL)
It measures unrealized gains across all wallets.
At market tops, most people are deep in profit and ready to dump.
• Current: 55.29%
• Top signal: ≥70–75%
• Status: Not overheated
7⃣ RHODL Ratio
It tracks the balance between recently moved coins (young) and older untouched ones.
High values = lots of fresh buyers = FOMO = possible top.
• Current: 2805
• Danger zone: 10,000+
• Status: Still safe
8⃣ Bitcoin Macro Oscillator
It is a combo of multiple high-signal metrics: MVRV, VWAP, CVDD, Sharpe, etc.
Gives a single score for macro trend conditions.
• Current: 0.96
• Top signal: ≥1.4
• Status: Still neutral

9⃣ Long-Term Holder Supply
It tells us how much $BTC is held by wallets that haven’t moved in over 155 days.
When this drops fast, it means long-term holders are selling = top vibes.
• Current supply: 15.87M BTC
• Status: Still strong
Long-term holders are not exiting yet. That’s bullish
🔟 Short-Term Holder % Supply
It shows what % of supply is held by recent buyers.
• Current: 20.17%
• Top indicator zone: ≥30%
• Status: Low

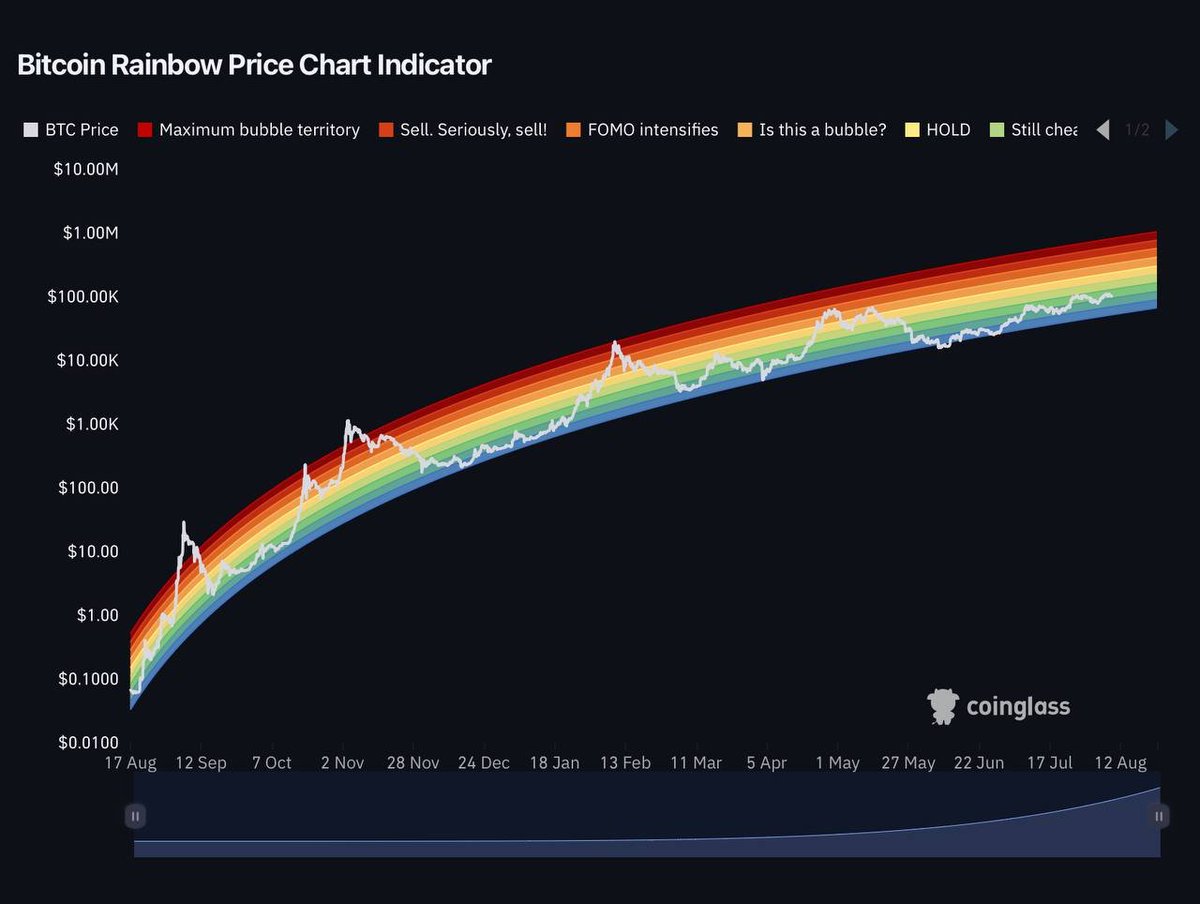
1⃣1⃣ Rainbow Chart
A long-term log chart with color bands showing different valuation levels.
• Current zone: Green (“Buy/Accumulate”)
• Top zone: Red (“Sell/Seriously”)
• Status: Far from danger
1⃣2⃣ Mayer Multiple
Price ÷ 200-day moving average.
High multiples = overheated market.
• Current: 1.11
• Top level: 2.2+
• Status: Very comfortable

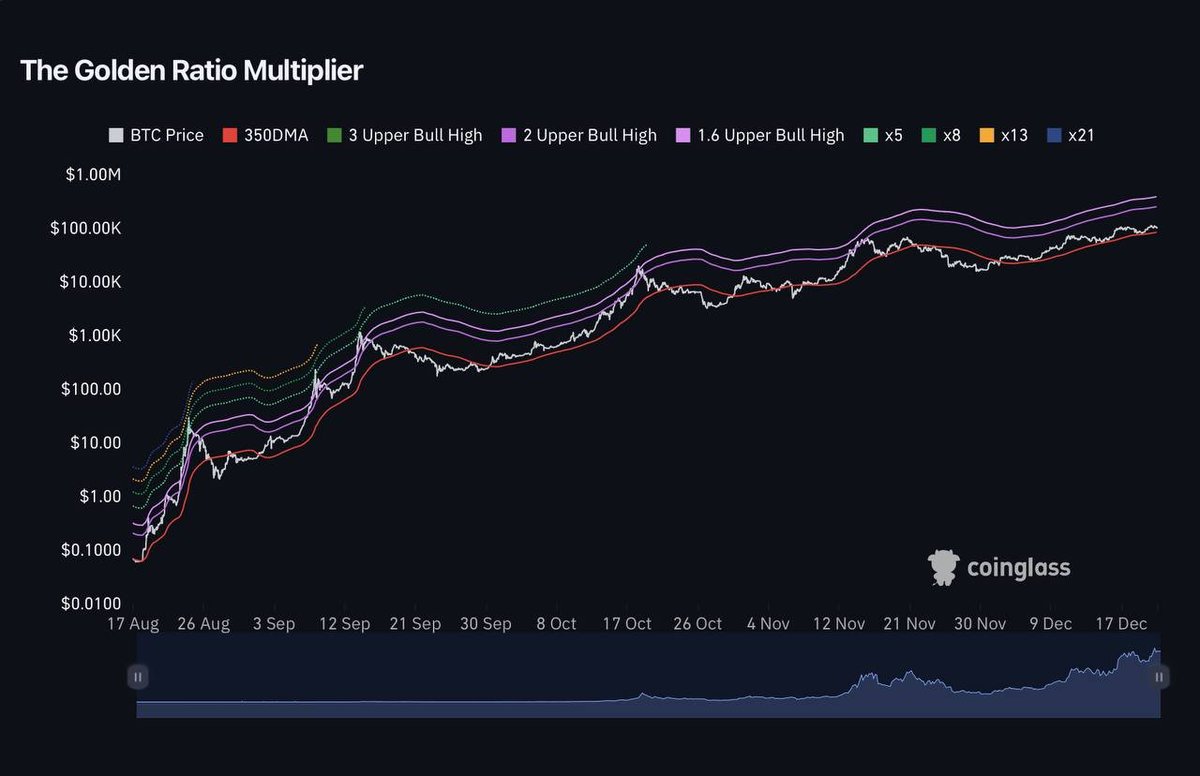
1⃣3⃣ 2-Year MA Multiplier
Price compared to its 2-year moving average.
Used by OGs for macro tops and bottoms.
• $BTC now: $107,000
• Top zone: $315,000+
• Status: Massive room to run
1⃣4⃣ Altseason Index
When altcoins start outperforming #BTC heavily, it usually comes right before a market-wide top.
• Current: 14
• Altseason = 75+
• Status: Too early
Alt euphoria hasn’t even started.

1⃣5⃣ MVRV Ratio (non-Z score)
A raw version of MVRV. Tends to spike before major corrections.
• Current: 2.24
• Top zone: ≥3
• Status: Neutral

What are these top indicators showing?
✅ 0 are flashing red
✅ Long-term holders aren’t selling
✅ Institutions are still buying
✅ No euphoria or mania yet
This is not the top.
503.47K
4.15K
The content on this page is provided by third parties. Unless otherwise stated, OKX is not the author of the cited article(s) and does not claim any copyright in the materials. The content is provided for informational purposes only and does not represent the views of OKX. It is not intended to be an endorsement of any kind and should not be considered investment advice or a solicitation to buy or sell digital assets. To the extent generative AI is utilized to provide summaries or other information, such AI generated content may be inaccurate or inconsistent. Please read the linked article for more details and information. OKX is not responsible for content hosted on third party sites. Digital asset holdings, including stablecoins and NFTs, involve a high degree of risk and can fluctuate greatly. You should carefully consider whether trading or holding digital assets is suitable for you in light of your financial condition.

