Bitcoin hits a new high of 110,000: Is it a repeat of the double-top trap or the start of a new cycle?
Original title: "Bitcoin stands at an all-time high again, will the bull market cycle be repeated?" Original
by ChandlerZ, Foresight News
On May 22, 2025, the price of Bitcoin soared above 110,000 USDT, refreshing the all-time high of 109599 USDT on January 20. This scene is reminiscent of that clip in November 2021. At that time, Bitcoin briefly crossed the highs of the beginning of the year and then quickly retreated, starting a long and deep bear market cycle. Now the market seems to have been pushed to the inflection point of fate again: will it break through again and open up a new round of upside, or will it fall into a double-top market after a "false breakout" as history repeats itself, and finally usher in a deep correction?
This is a problem that Bitcoin cannot avoid whenever it approaches an all-time high. Over and over again, we've seen a similar structure over and over again in the past few bull runs: highs and high sentiments, and discussions about whether the cycle apex has been reached. In this round, although the rally and rhythm are vaguely familiar, the deeper market structure has changed significantly.
Prices are repeating themselves, but the market is not yesterday. Against this backdrop, do we continue to believe that the "cyclical law" brought about by the halving still dominates the fate of Bitcoin? Or should we admit that a new rhythm is already unfolding in ETF funding, on-chain structures, and macro narratives?
Returning to the most essential observation method, perhaps the data on the chain, the mirror image of history, and the traces of behavior can still provide us with some kind of periodic enlightenment. Is the current wave of rise the final sprint of cyclical inertia, or a new starting point after reconstructing the cyclical structure? Perhaps the answer lies in the context of the data.
Is the market repeating its historical path?
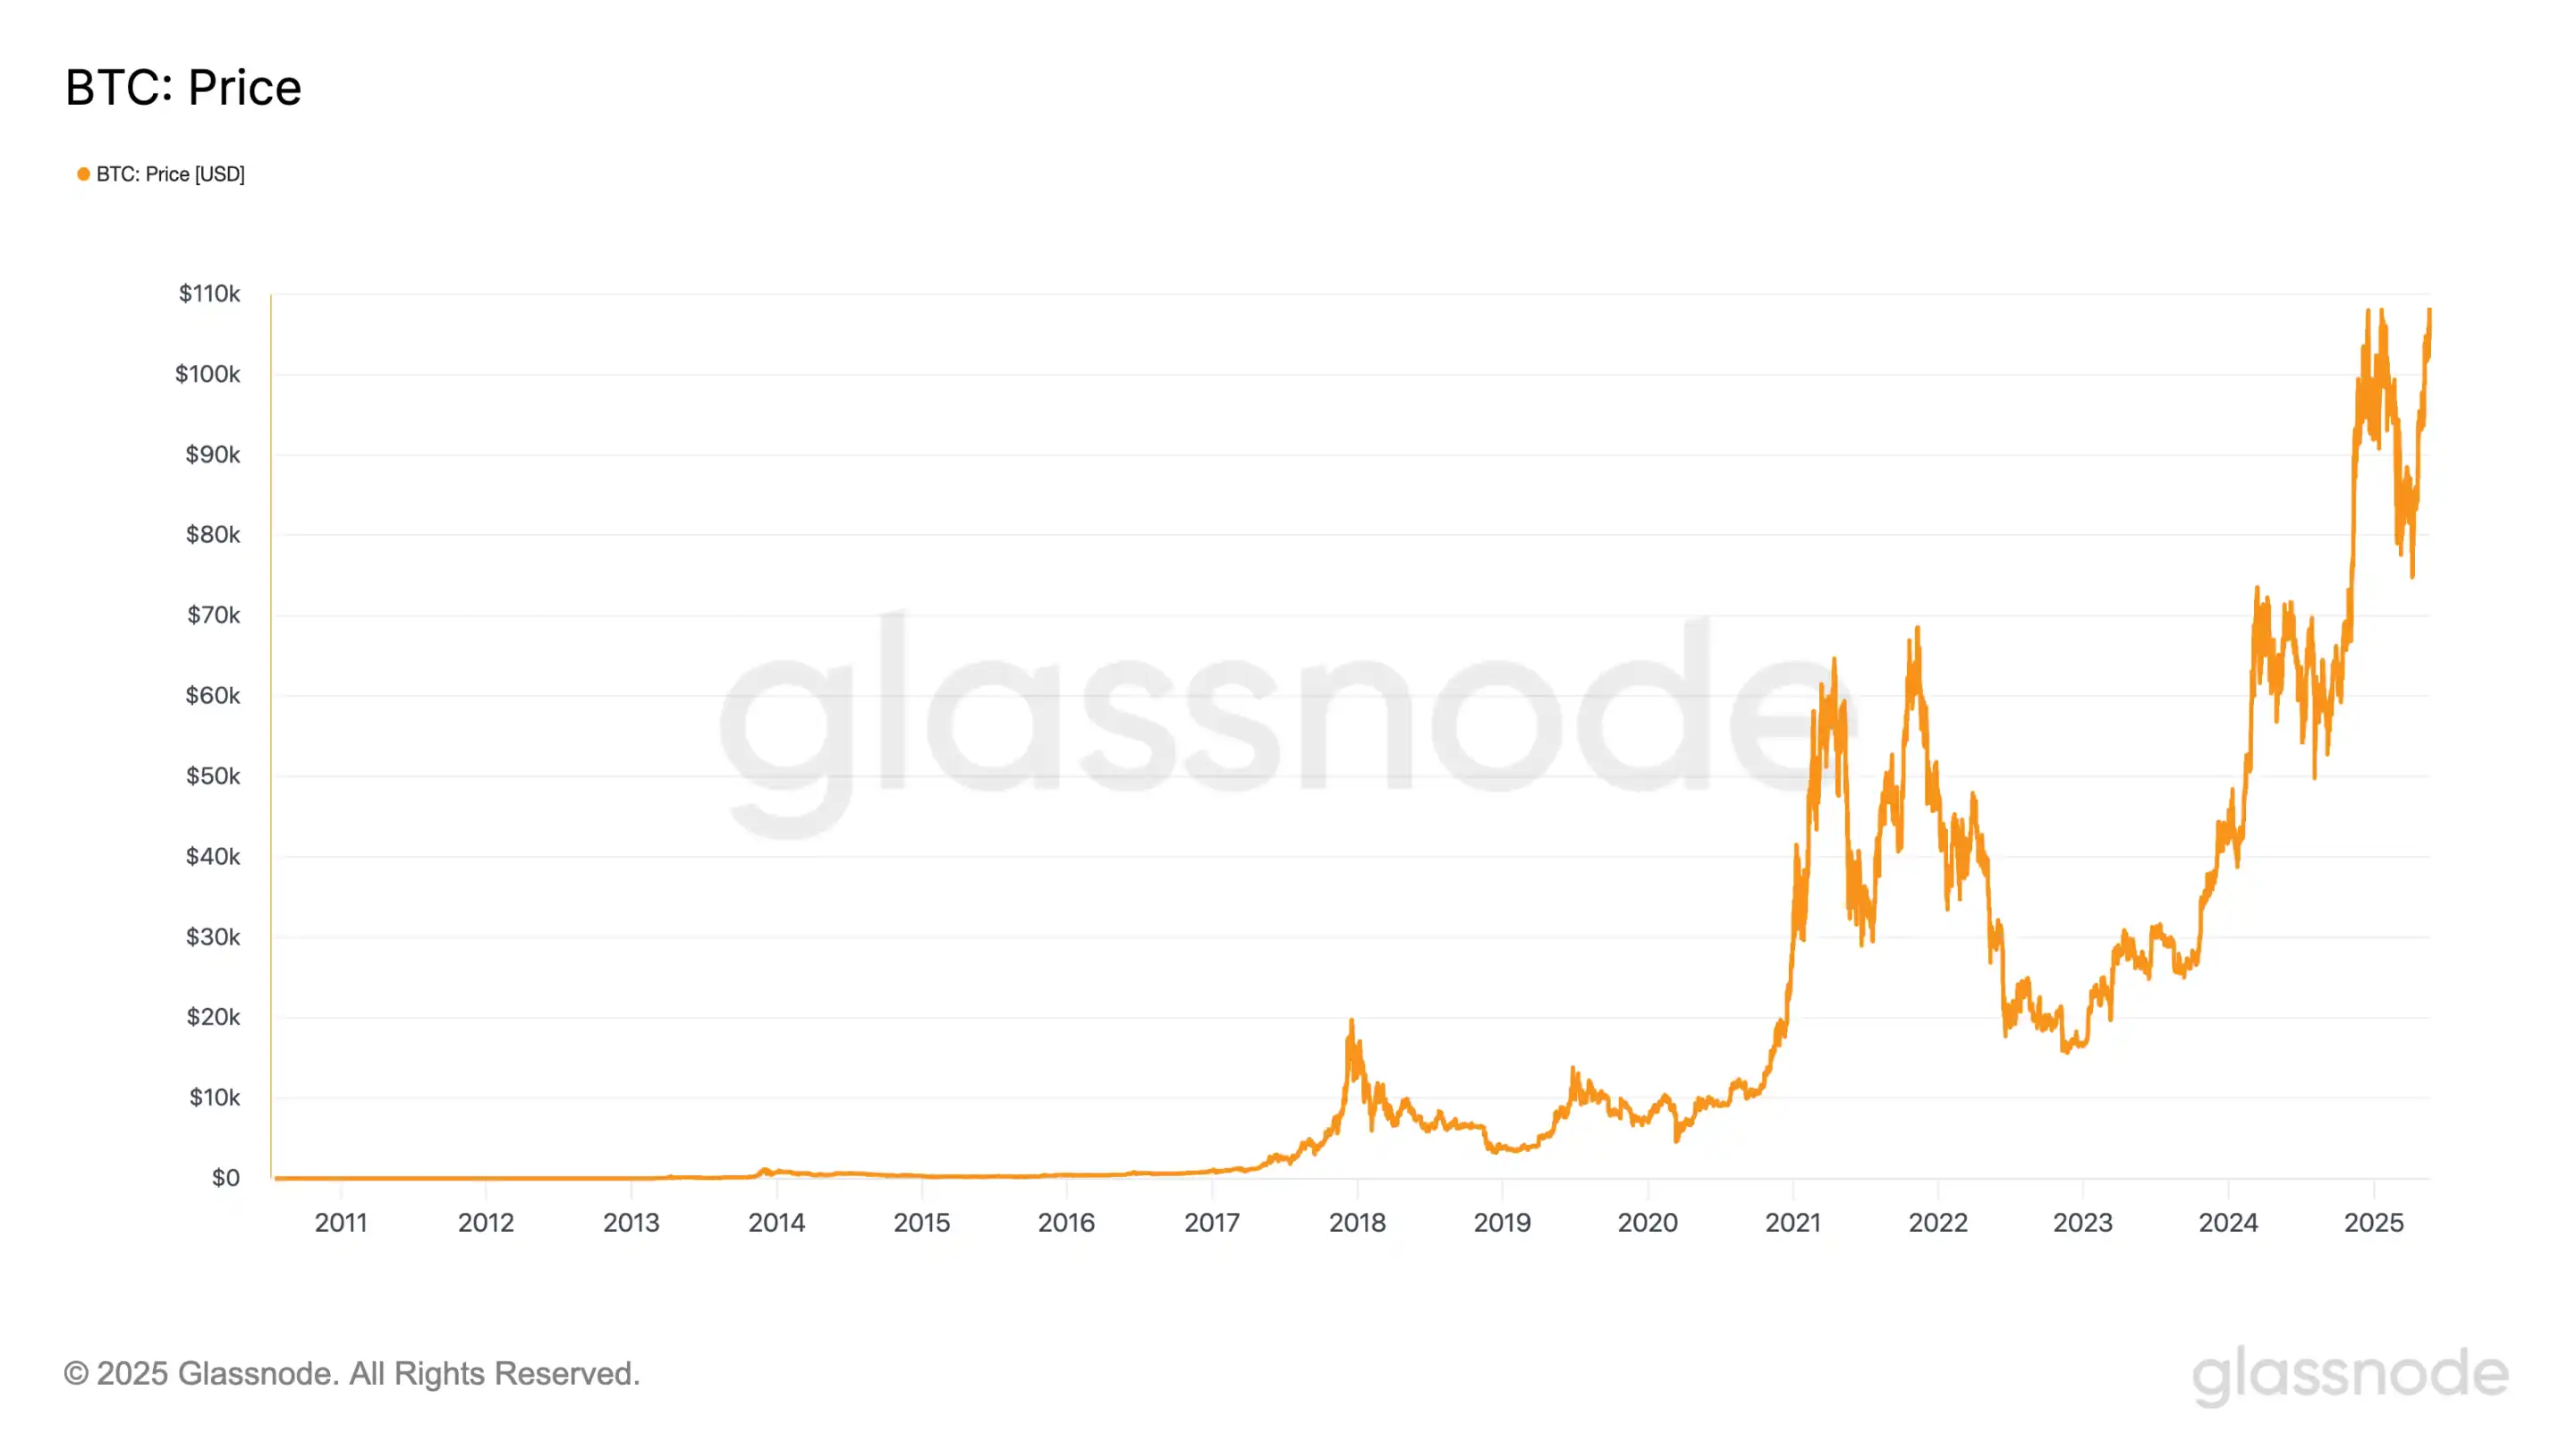
Bitcoin's historical price movements, although volatile, can be roughly divided into the following typical cycles of "halving drive + bull/bear rotation":
Since 2011, the price of Bitcoin has been repeatedly evolving in the logic of "halving drive - supply and demand imbalance - bull market outbreak - top pullback", and each cycle ends with a higher price peak, and the double-top structure in 2021 is undoubtedly the most alarming example.
Bitcoin hit a phased high for the first time in April 2021, when the market sentiment was high, driven by multiple positives such as the positive stimulus of Coinbase's listing, the continuation of loose monetary policy, and the continuous absorption of grayscale GBTC, and the price broke through the $60,000 mark for the first time. But that high didn't last long. After entering May, as the Federal Reserve released forward-looking signals of balance sheet reduction and interest rate hikes, coupled with the policy risk of China's large-scale liquidation of domestic mining farms, the Bitcoin market quickly fell into a correction, falling to around $30,000 in less than three months, completing a deep adjustment in the middle.
A few months later, the market gradually digested the negative sentiment and bottomed out in late summer. Driven by positive narratives and inflows, fueled by El Salvador's official adoption of Bitcoin as legal tender, rising global inflation concerns, and strong optimism about the approval of the first Bitcoin futures ETF in the US, the rally refocused and briefly spiked above an all-time high of around $69,000 on November 10 before retreating rapidly, forming a distinct, multi-month "double top structure" together with the April high.
In the end, this triple resonance of record high prices, active on-chain cashing, and shrinking demand constitutes a typical "false breakout" pattern. Bitcoin quickly retreated after briefly crossing the top, starting a downward cycle. This structure is presented as a "local new high + volume divergence + instantaneous reversal" in the technical pattern, which is a typical double-top top signal, and also provides an important lesson for the current market at a stage close to historical highs.
Will history converge?
The slope and pattern of the current trend are quite similar to those on the eve of November 2021. What's more noteworthy is that multiple indicators on the chain are releasing signals of structural convergence.
The latest data shows that the MVRV of long-term holders has climbed to 3.3, approaching the "greedy red zone" defined by Glassnode (above 3.5); The MVRV of short-term holders has also risen sharply from a low of 0.82 to 1.13, meaning that most of the short-term funds in the market have re-entered floating profit territory. From a behavioral finance perspective, this structural change is a necessary condition for the formation of top pressure: when the vast majority of investors return to a surplus state, the desire to cash out tends to increase in tandem.
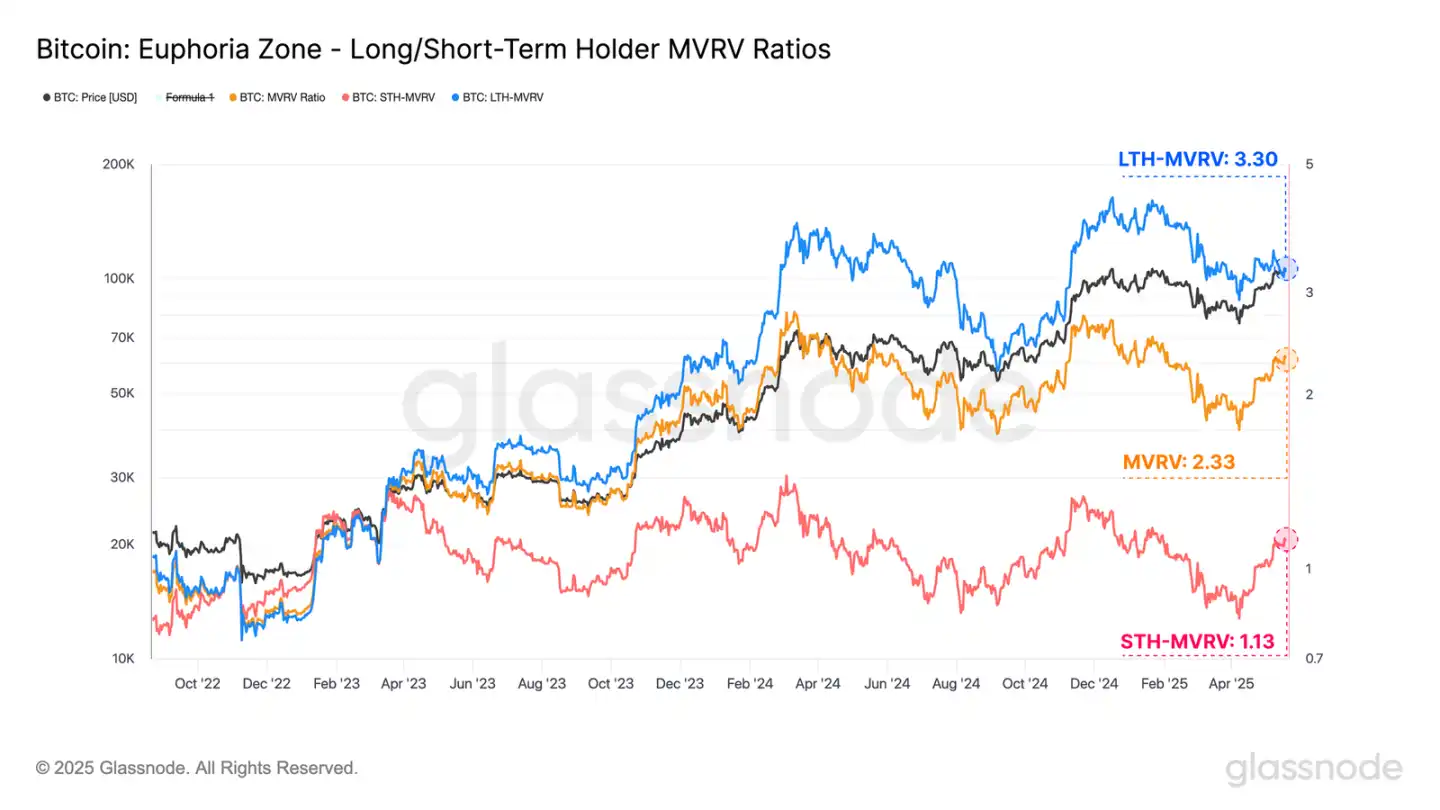
However, if we analyze from the perspective of "seller behavior pressure" of the on-chain structure, although the seller-risk ratio of short-term investors has increased significantly, indicating that some profits have been released on the chain, the overall value is still at a historically low level. This state of affairs reflects that although investor sentiment has warmed up and some funds have chosen to take profits in the floating profit range, the overall market has not yet entered an imbalance dominated by "collective cashing momentum".
This means that although the upside has been initially suppressed, the market is not out of control. As long as the follow-up liquidity continues to be stable, the market still has the conditions to continue the structural upward movement, rather than being pushed to the ultimate top.