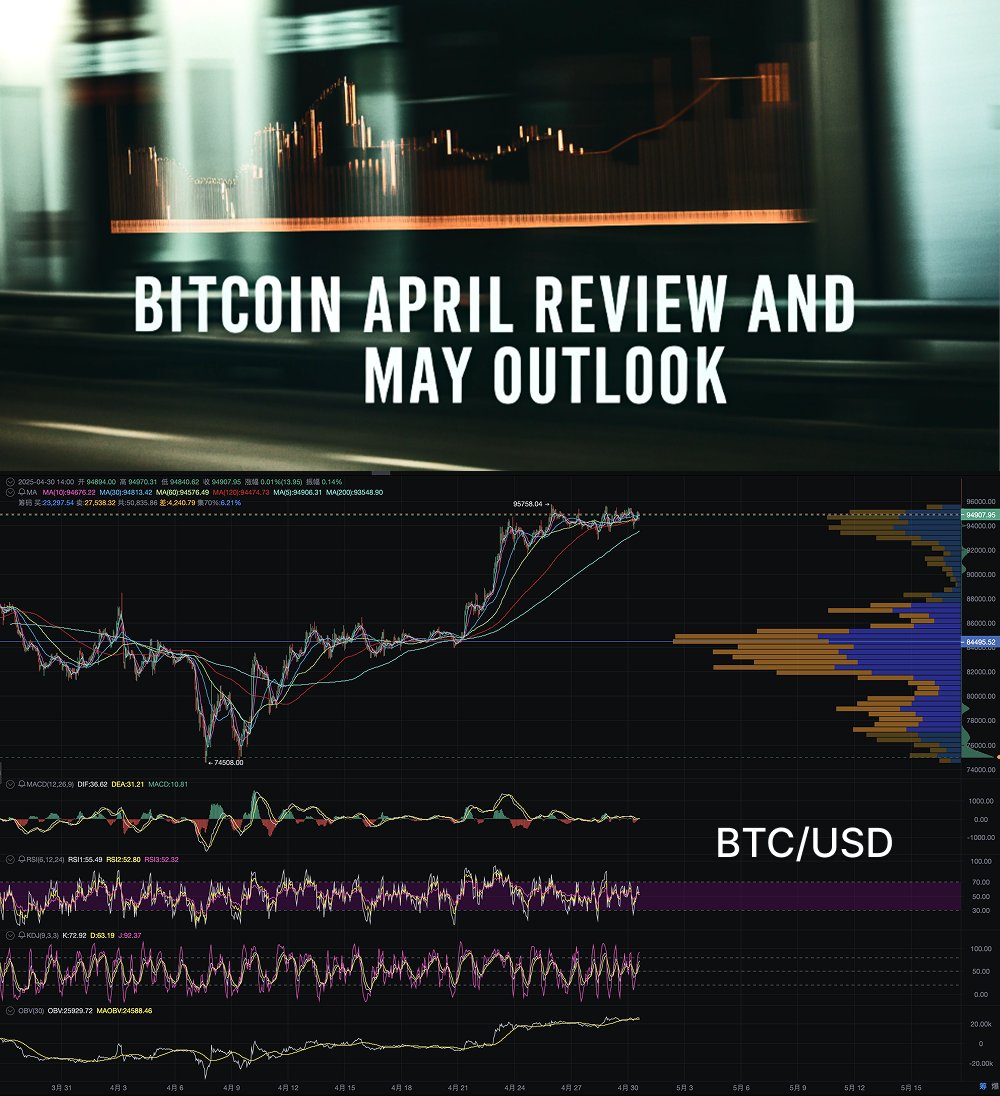
In April, BTC strongly rebounded from $75,000 to $95,700, with a monthly increase of nearly 28%! After a deep V-shaped reversal, it entered a high-level consolidation phase, with the candlestick chart showing a "flag" pattern indicating accumulation. The main cost zone of $84,500-$86,000 has become strong support, OBV momentum is flattening, MACD is converging, RSI is neutral, and the short-term direction remains undecided. ETF funds are accelerating inflows, option IV is declining, and market sentiment is cautious.
If BTC breaks through $96,000 with volume, the target will be $102,000-$105,000, with ETF inflows and institutional participation potentially acting as catalysts. If it falls below $90,000, support can be found at $88,000 and the $84,500-$86,000 range, but beware of macroeconomic risks.
The battle between bulls and bears is intensifying, and May may see a directional breakout! Which path do you favor?
Show original
2.61K
1
The content on this page is provided by third parties. Unless otherwise stated, OKX is not the author of the cited article(s) and does not claim any copyright in the materials. The content is provided for informational purposes only and does not represent the views of OKX. It is not intended to be an endorsement of any kind and should not be considered investment advice or a solicitation to buy or sell digital assets. To the extent generative AI is utilized to provide summaries or other information, such AI generated content may be inaccurate or inconsistent. Please read the linked article for more details and information. OKX is not responsible for content hosted on third party sites. Digital asset holdings, including stablecoins and NFTs, involve a high degree of risk and can fluctuate greatly. You should carefully consider whether trading or holding digital assets is suitable for you in light of your financial condition.

