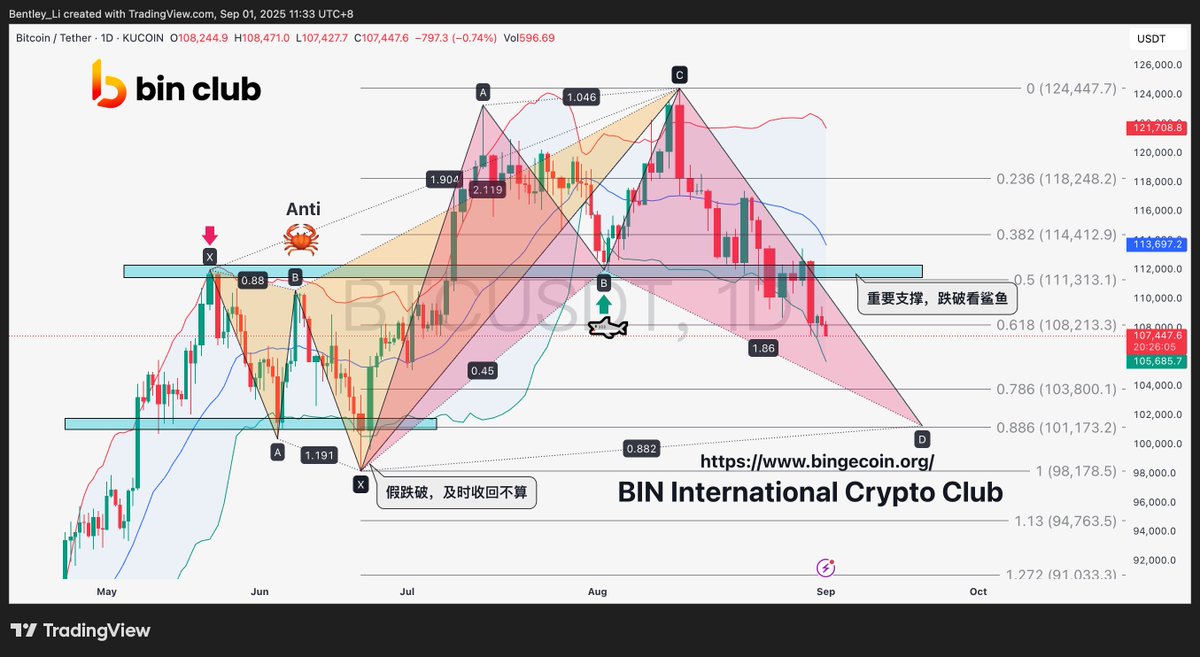
#BTC The market continues to look at the daily chart. After breaking the important support at 110k, although there was an AR rebound, it has not been able to break through the mid-line resistance on the daily chart. We continue to see support around 101k in the shark pattern. Consider averaging down near this level, and set a stop-loss if it breaks below 100k. If you understand, like and reply with 1. If you want to see other coins, just leave a message.

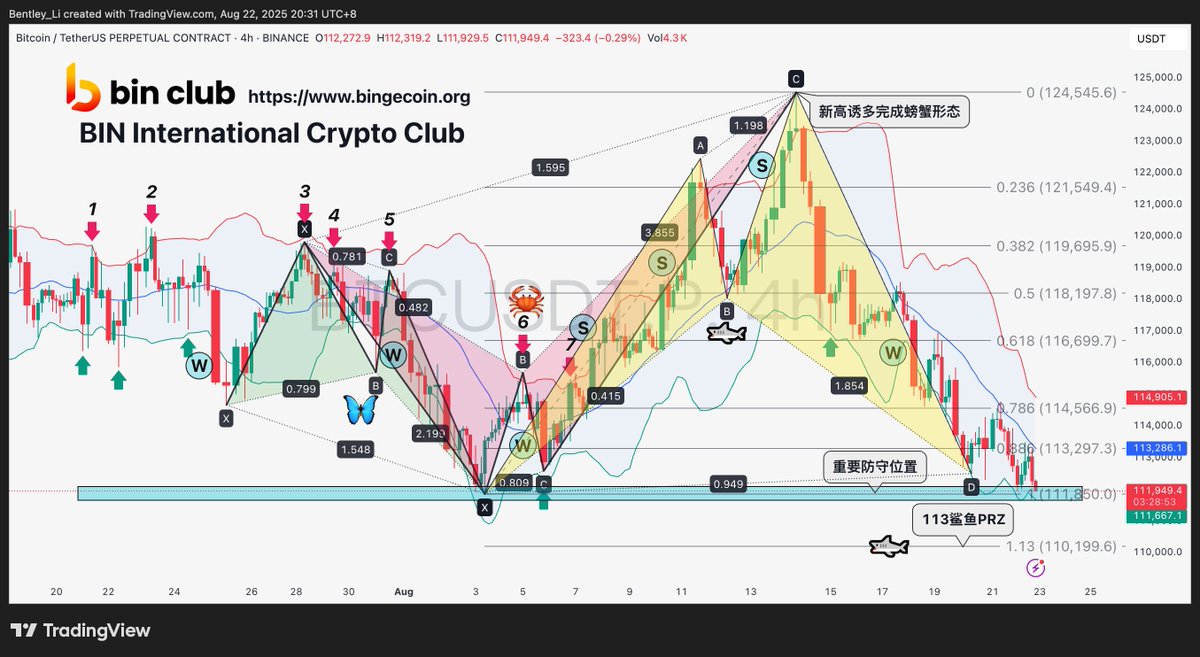
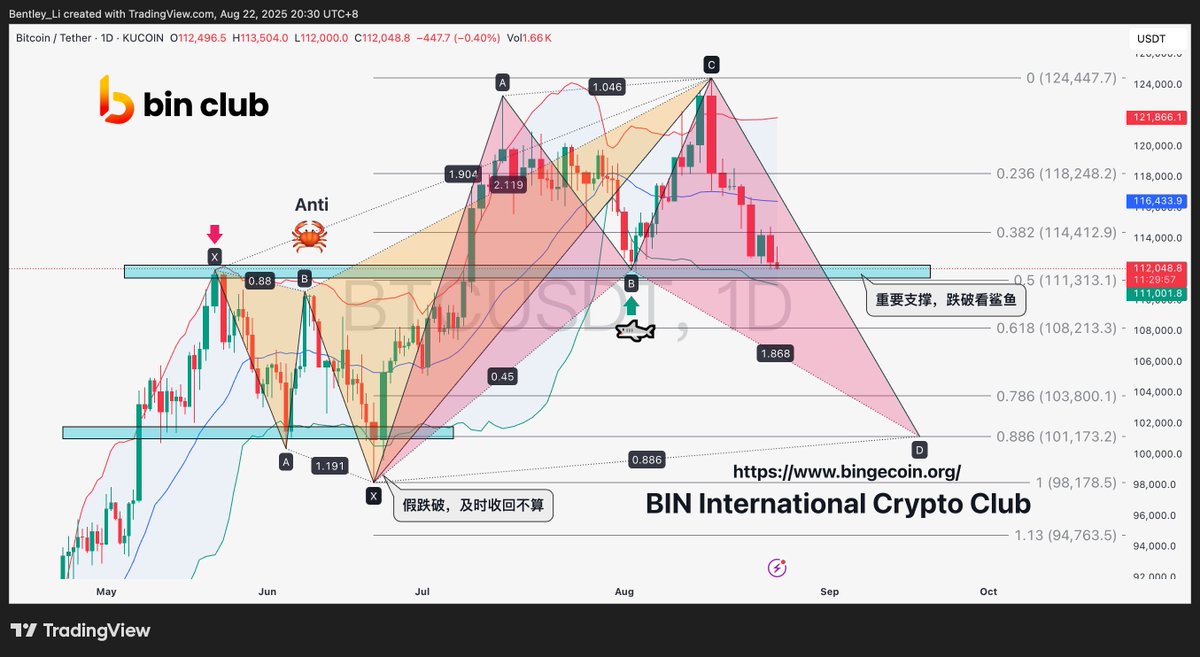
#BTC After the price surged and completed the crab pattern, it has retraced to a very critical support level. Let's take a look at the 4-hour and daily charts, and please support with a like if you find this helpful.
- 4h: Currently, there are two support levels: one is around the ice line at 11,200, and the other is around 110,000 for the shark pattern. If these levels hold, we can expect a bottoming and rebound.
- Daily: If it breaks the support, we will directly look at the shark pattern on the daily chart around 101,100. There's no need to panic; reaching that level would be a better entry point.


20.03K
20
The content on this page is provided by third parties. Unless otherwise stated, OKX is not the author of the cited article(s) and does not claim any copyright in the materials. The content is provided for informational purposes only and does not represent the views of OKX. It is not intended to be an endorsement of any kind and should not be considered investment advice or a solicitation to buy or sell digital assets. To the extent generative AI is utilized to provide summaries or other information, such AI generated content may be inaccurate or inconsistent. Please read the linked article for more details and information. OKX is not responsible for content hosted on third party sites. Digital asset holdings, including stablecoins and NFTs, involve a high degree of risk and can fluctuate greatly. You should carefully consider whether trading or holding digital assets is suitable for you in light of your financial condition.

