BITCOIN THREAD with all of the charts, models, and macro views to understand the drivers and WHERE we are likely to move
you're going to want to bookmark this one anon
🧵🧵🧵🧵
Fundamentally, Bitcoin is a release valve for macro liquidity that functions on the far end of the risk curve.
So we want to map all of the flows for interest rates and quanity of money in the system.
Don't worry, I did this for you.
Here are all the charts in Tradingview you want to save:
Bitcoin correlation with interest rates:
Bitcoin correlation with equities:
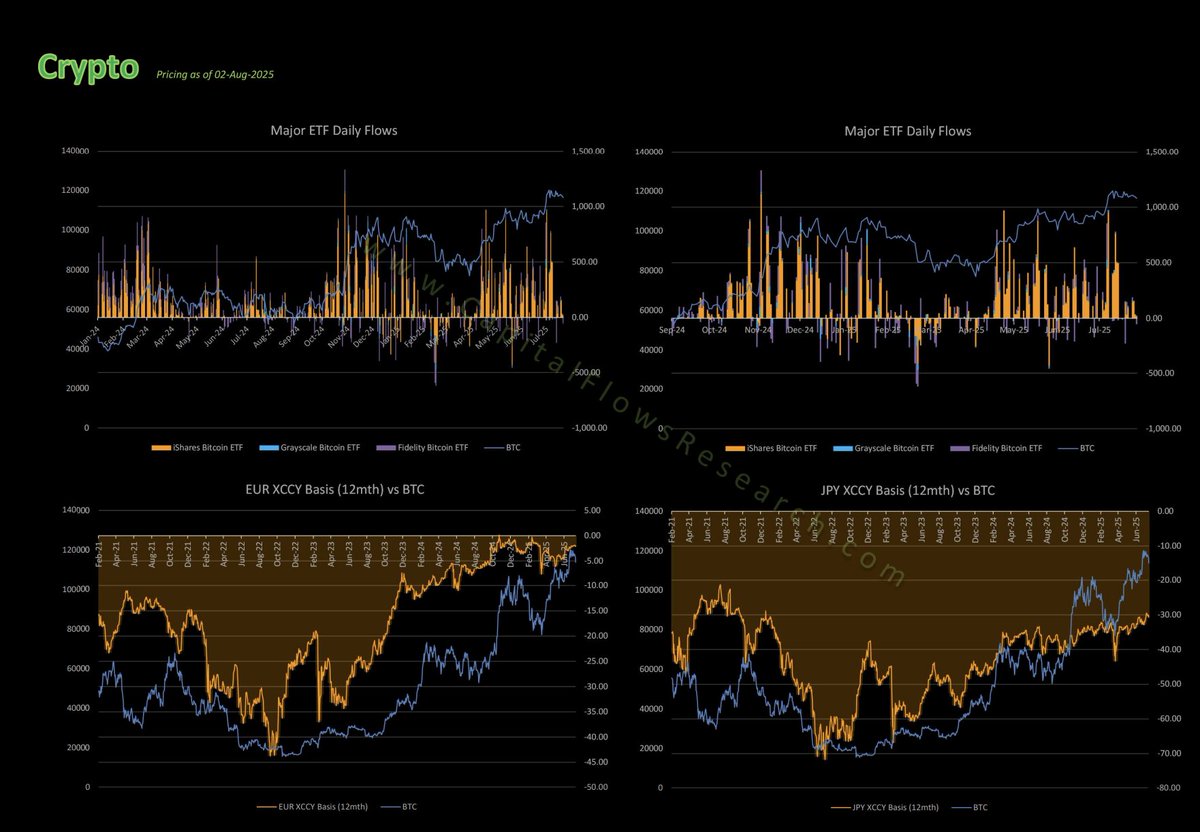
Bitcoin ETF flows and correlation with cross currency basis swaps: Every day I send out an updated tear sheet with these charts, especially the xccy and carry trade index:
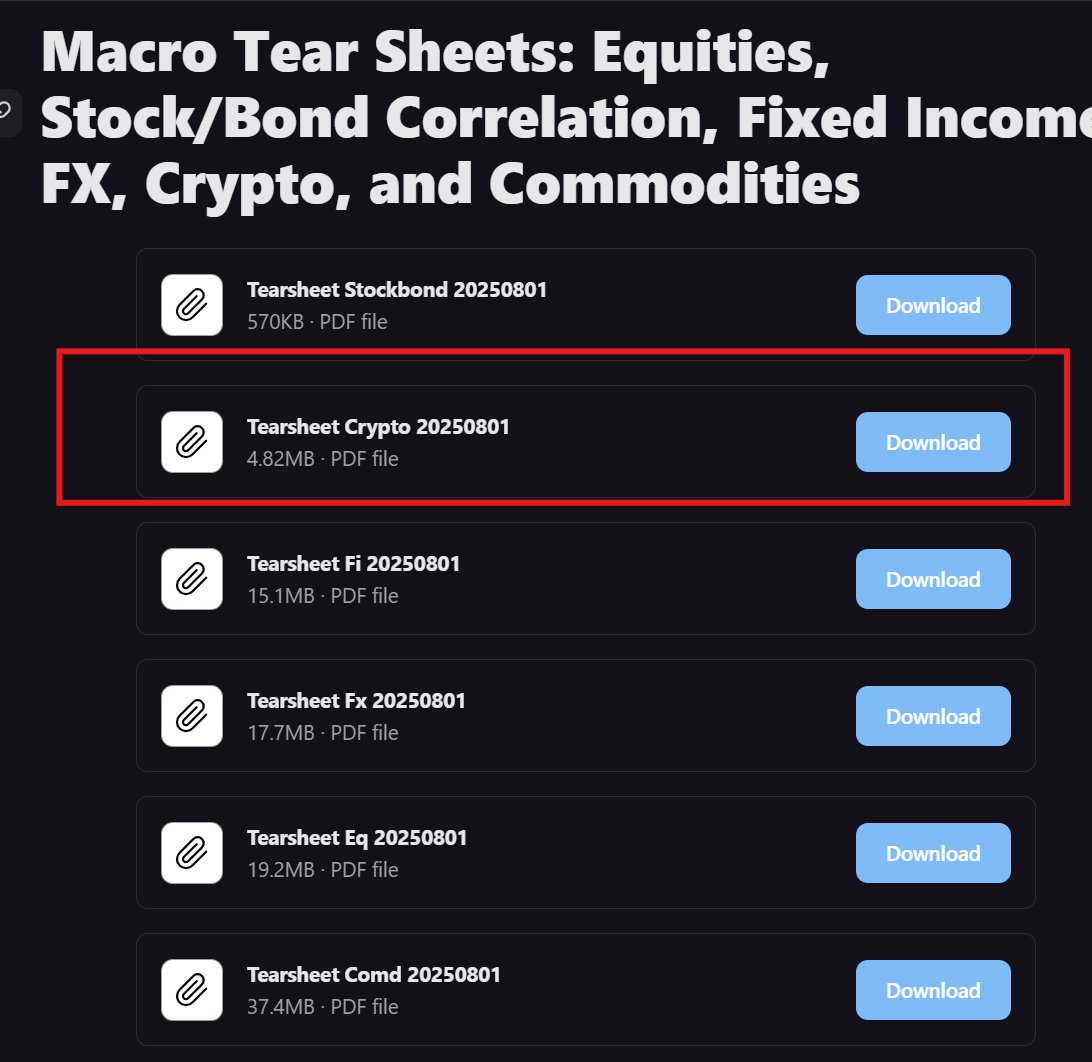
If you go to the most recent tracker, you can scroll down to the crypto tear sheet and its here. These are sent out every day free.
Here is the chart of ETF flows and the XCCY with BTC:
All the major treasury companies:
See the report I wrote here on explaining how the treasury companies are changing the microstructure of the market here:
So how do we pull all of these macro forces together and connect them to a tangible view on Bitcoin? Everything starts with this type of mindset for taking views on ANY time horizon.
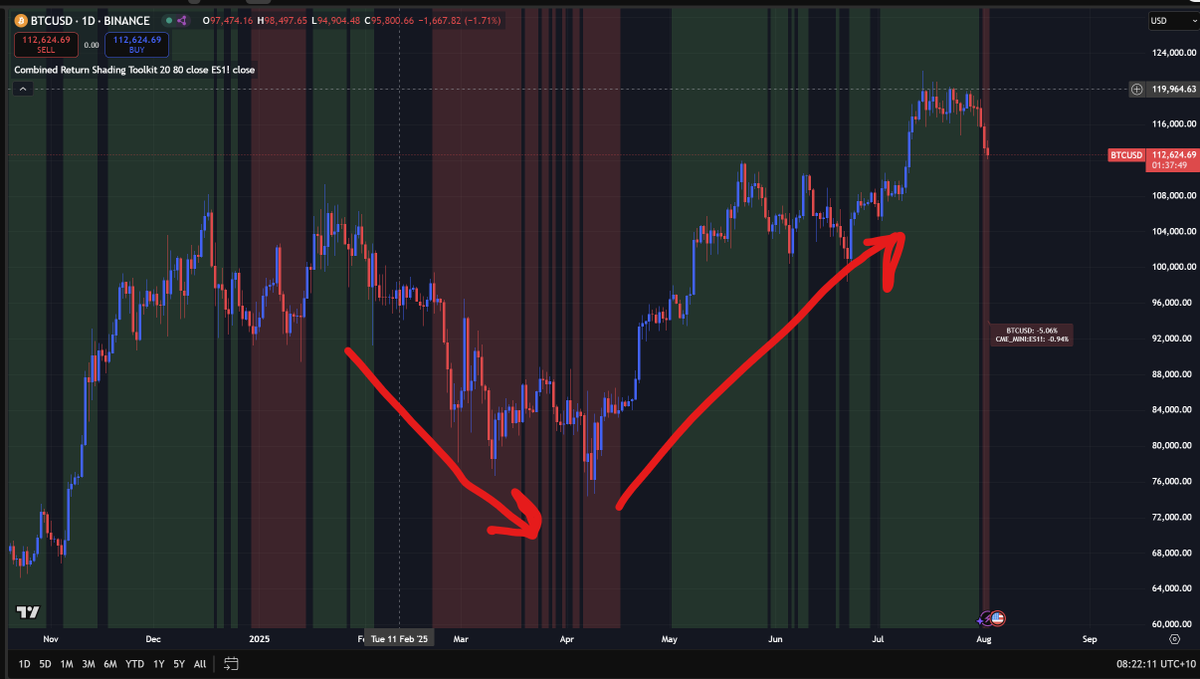
Bitcoin always moves through periods of outperforming and underperforming ES as macro liquidity rises and falls.
The chart below maps Bitcoin into regimes based on the following logic:
IF BTC returns are positive AND outperforming ES=Green
IF BTC returns are negative AND underperforming ES=RED.
You can find the script i built for this here:
So what has been happening? Bitcoin went down and underperformed ES during the sell off earlier this year, flipped bullish and has been outperforming up till last week.
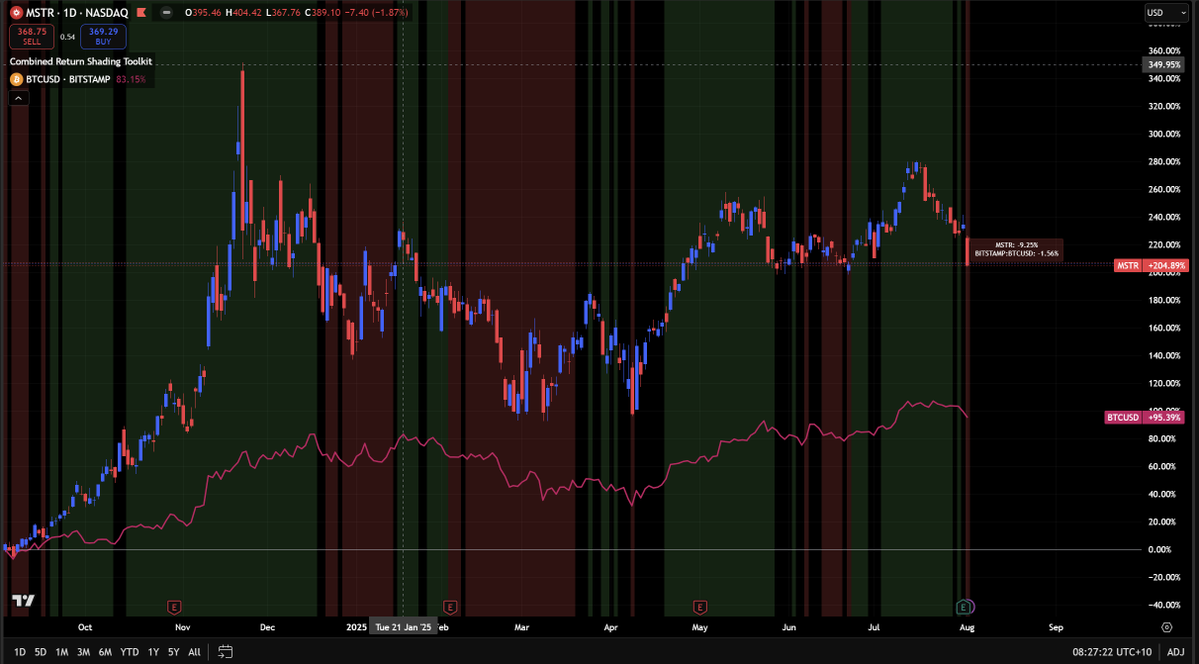
Notice that $MSTR just after their earnings call began to turn negative and undperform BTC as well, which is a key positioning signal
The Red regime shows MSTR returns turning negative on a 20d lookback and underperforming BTC.
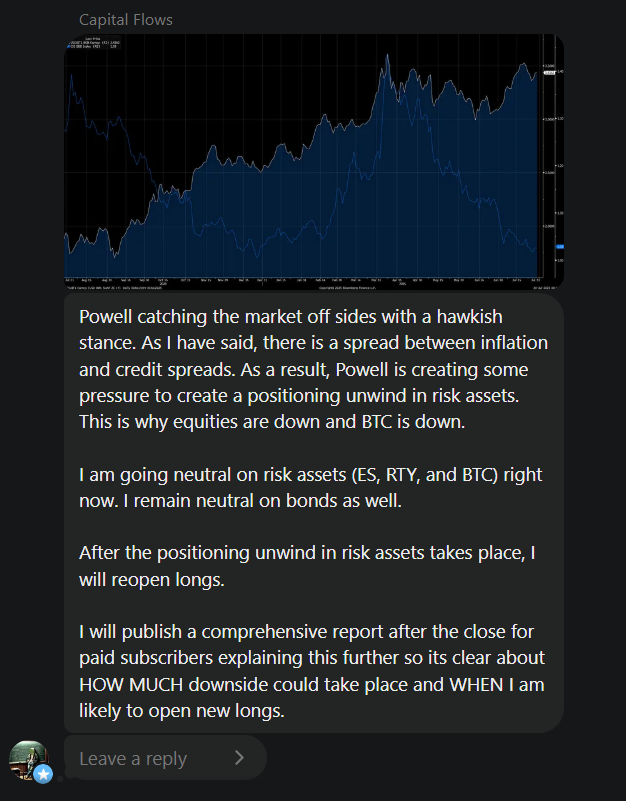
All of the macro signals we are seeing are screaming that being neutral risk assets until a short term positioning unwind takes place is the best stance.
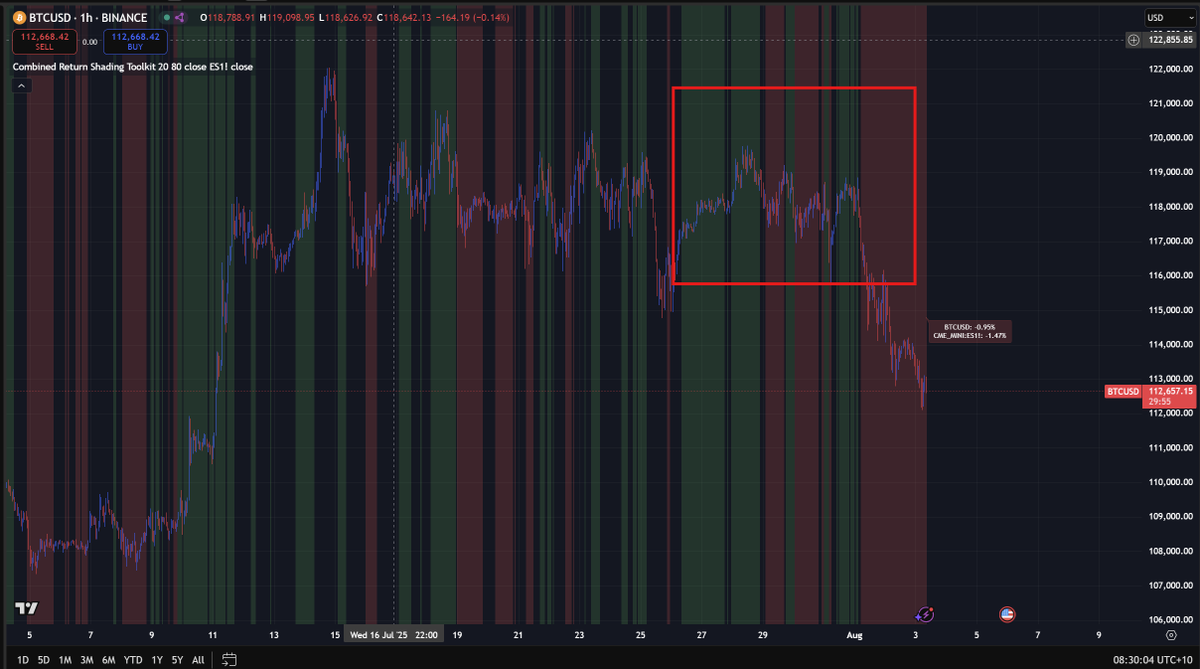
My view is that we have some short term downside risk in Bitcoin. Notice specifically that during the periods of green for Bitcoin last week before FOMC, we couldnt make new highs. This is why when we began to shift red after FOMC, it was a signal.
In other words, the green periods in the box were when Bitcoin was positive in returns AND outperforming ES and it still couldnt make a new high on an outright basis.
169.15K
525
The content on this page is provided by third parties. Unless otherwise stated, OKX is not the author of the cited article(s) and does not claim any copyright in the materials. The content is provided for informational purposes only and does not represent the views of OKX. It is not intended to be an endorsement of any kind and should not be considered investment advice or a solicitation to buy or sell digital assets. To the extent generative AI is utilized to provide summaries or other information, such AI generated content may be inaccurate or inconsistent. Please read the linked article for more details and information. OKX is not responsible for content hosted on third party sites. Digital asset holdings, including stablecoins and NFTs, involve a high degree of risk and can fluctuate greatly. You should carefully consider whether trading or holding digital assets is suitable for you in light of your financial condition.

