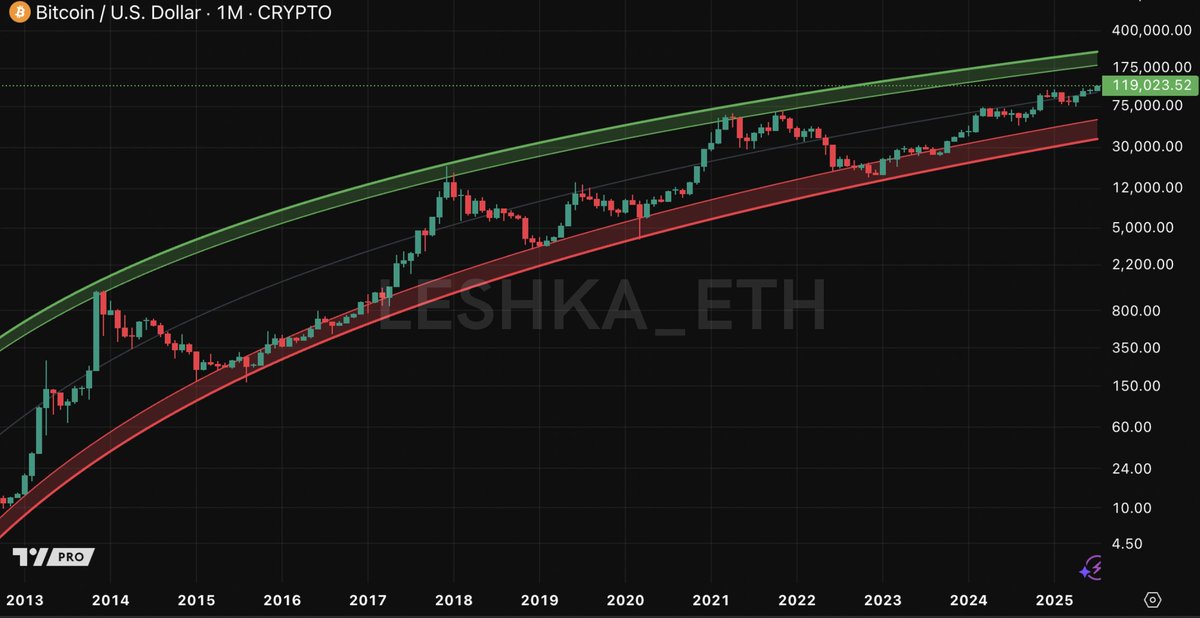
Indicators that I check to predict Top of the Bullrun
a thread 🧵🔽
I’ve seen 3 full market cycles & every time majory can't predict the pico top. Never:
• Some say it’s the final top
• Others think it’s just getting started
But if you follow real indicators, the signs are always clear
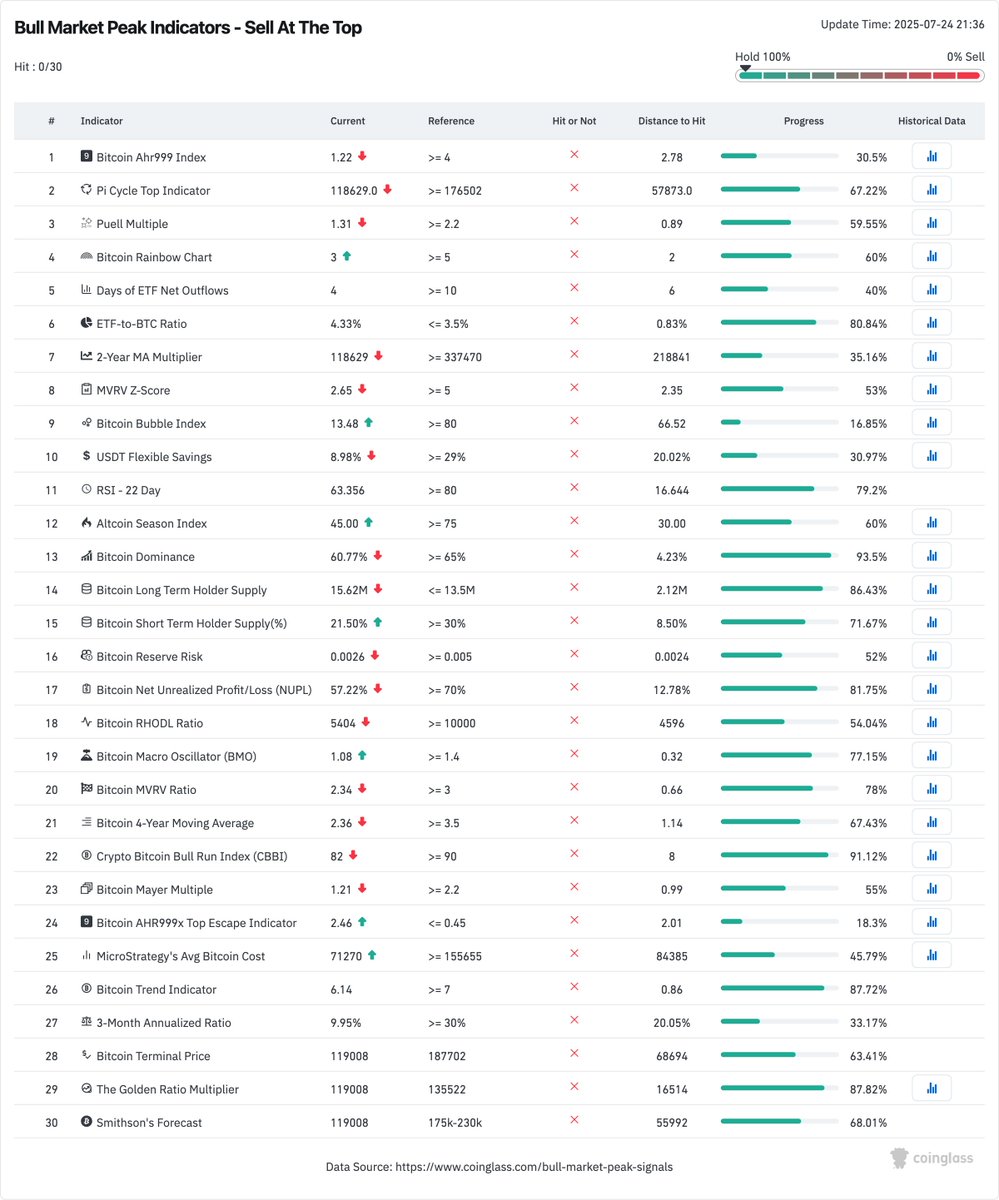
I mostly monitor 5 major indicators that have accurately signaled every previous market peak:
• Pi Cycle Top
• Bitcoin AHR999 Index
• Puell Multiple
• Rainbow Chart
• Bitcoin Bubble Index
At this moment? None of them are flashing a market top
Here's a breakdown of each👇
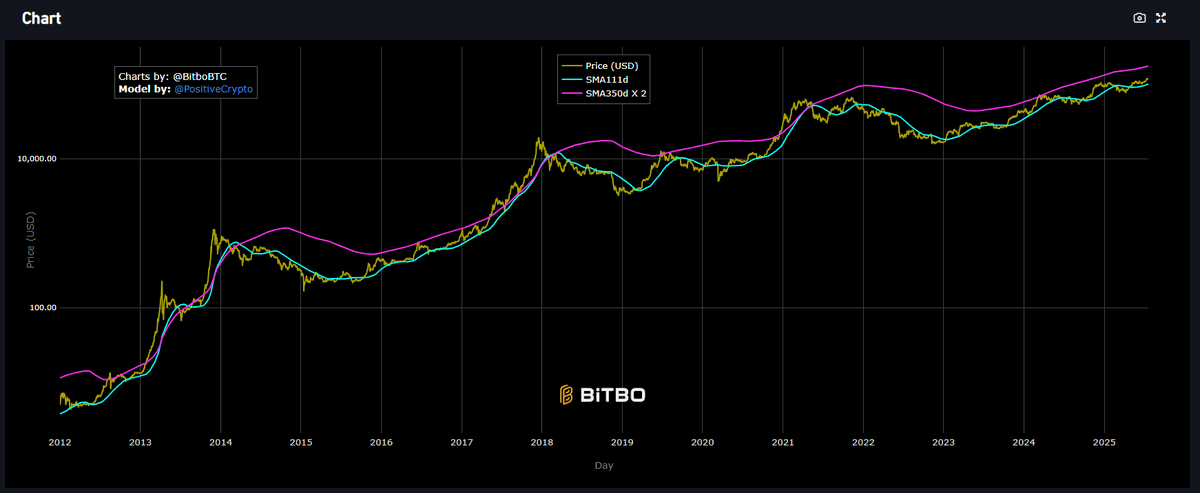
Pi Cycle Top: No signal yet
The 111-day moving average still hasn’t crossed above 2× the 350-day moving average
That precise crossover perfectly marked the tops in 2013, 2017, and April 2021
Currently, we’re only about 69% of the way to that threshold
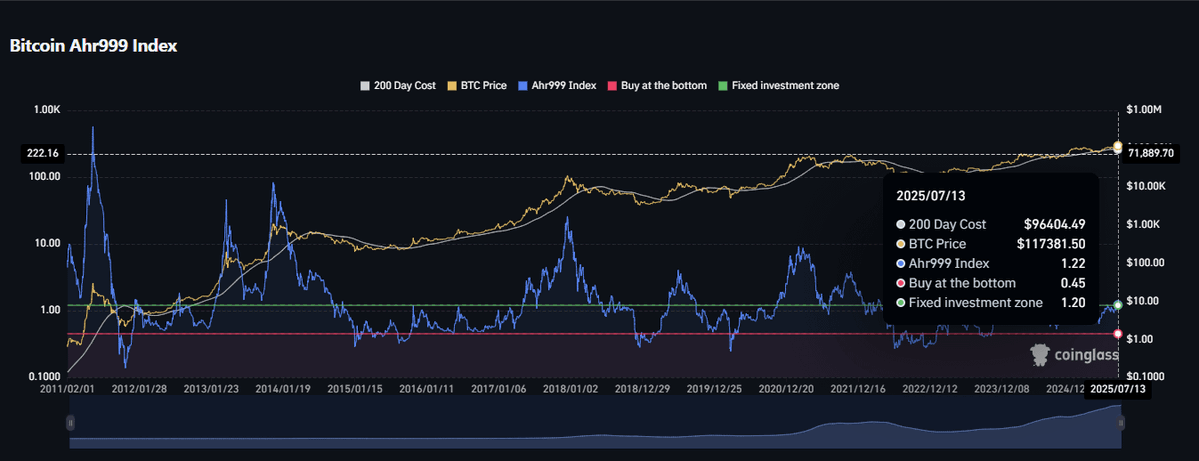
Bitcoin AHR999 Index ≈ 1.22
The risk zone typically begins around 3–4
At the last cycle peak, the index spiked to 9.0
Sitting at 1.25 today, Bitcoin is trading above fair value, but far from bubble territory.
This suggests we’re still mid-cycle
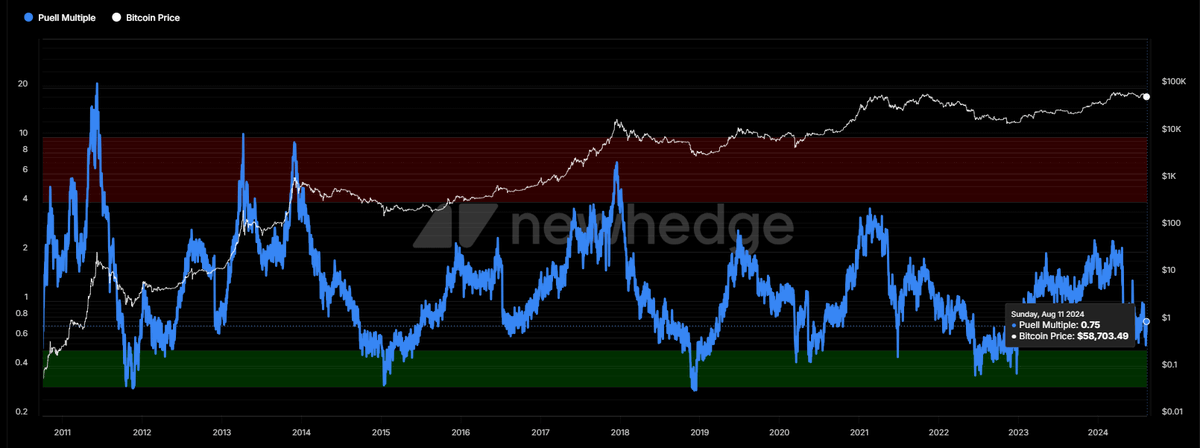
Puell Multiple ≈ 0.8
Historically, major tops form when this hits 4/5 - that’s when miners start heavily selling, triggering corrections.
At 0.8 we’re still well below that danger zone.
Even with Bitcoin at $120K, miners' revenue isn't overstretched.
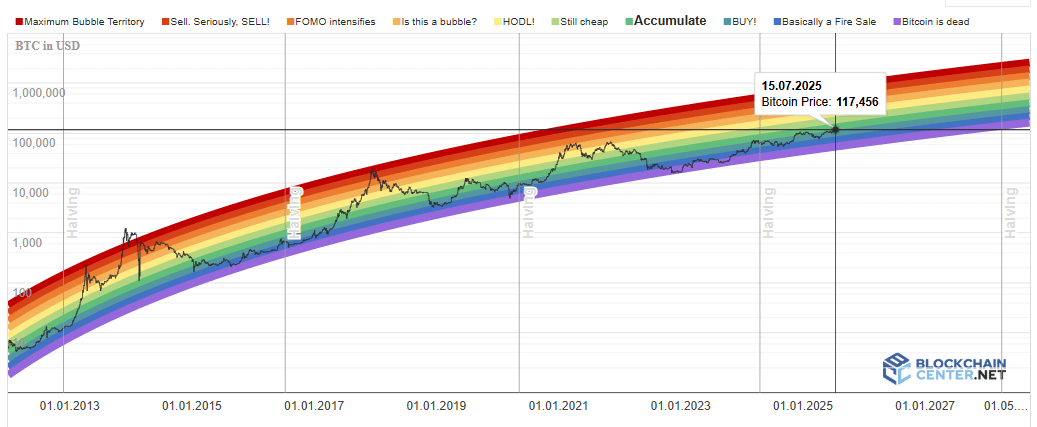
Rainbow Chart: Currently in the green zone
The danger zone sits in bright red - where past blow-off tops have occurred
Right now, Bitcoin is hovering around the middle of the spectrum
According to this model, there's still room for growth before we reach the peak euphoria
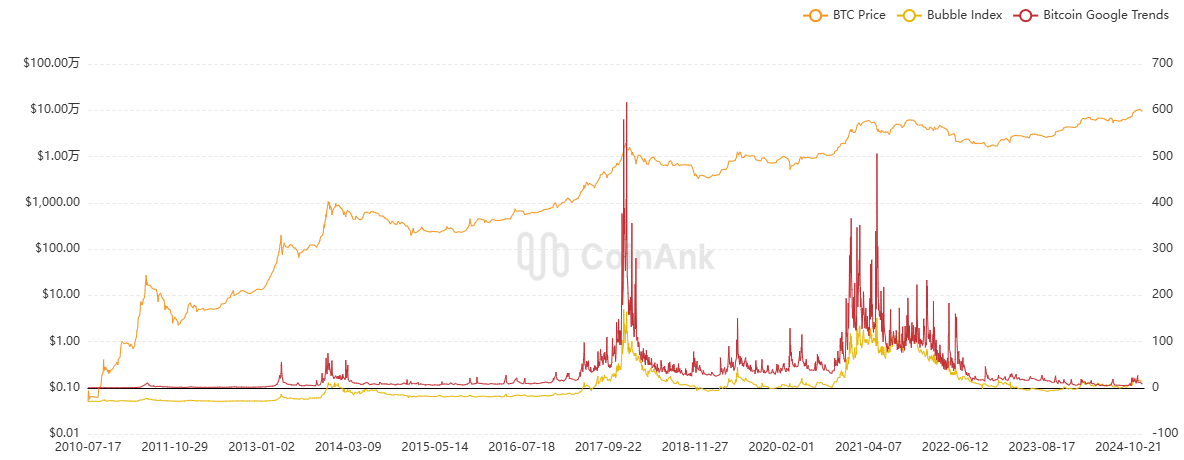
Bitcoin Bubble index: Sitting at 12–15
In past bull market tops, this index soared to 80–100
Today? We're far from that - no hype, no mania, and the retail crowd is still mostly on the sidelines
Search interest is low, inflows are modest, and social sentiment remains quiet
All 5 indicators agree:
• Not overbought
• Not euphoric
• Not the peak
This is a mid-run pause - selling now risks missing the run to $150K+
What’s the move now?
Stay patient and monitor key signals
Don’t exit positions just because CT feels overheated and depressed about recent $PUMP price action
True market tops arrive with retail FOMO, explosive altcoin rallies, and extreme indicator readings
We’re not in that zone yet.

112.47K
788
The content on this page is provided by third parties. Unless otherwise stated, OKX is not the author of the cited article(s) and does not claim any copyright in the materials. The content is provided for informational purposes only and does not represent the views of OKX. It is not intended to be an endorsement of any kind and should not be considered investment advice or a solicitation to buy or sell digital assets. To the extent generative AI is utilized to provide summaries or other information, such AI generated content may be inaccurate or inconsistent. Please read the linked article for more details and information. OKX is not responsible for content hosted on third party sites. Digital asset holdings, including stablecoins and NFTs, involve a high degree of risk and can fluctuate greatly. You should carefully consider whether trading or holding digital assets is suitable for you in light of your financial condition.

