The hidden and extremely practical two-stage auxiliary function inventory in GMGN
GMGN has been continuously updated until now, and I think it is the most comprehensive and powerful trading tool at present.
Especially for the second stage, the richness of information is the most important, and a successful second stage transaction is inseparable from multi-dimensional comprehensive information.
GMGN has a lot of useful information that all other DEXs don't have, and some of it is hidden in obscure places.
The following will explain them to you one by one, I hope it will be helpful to you.
1. The best bubble chart
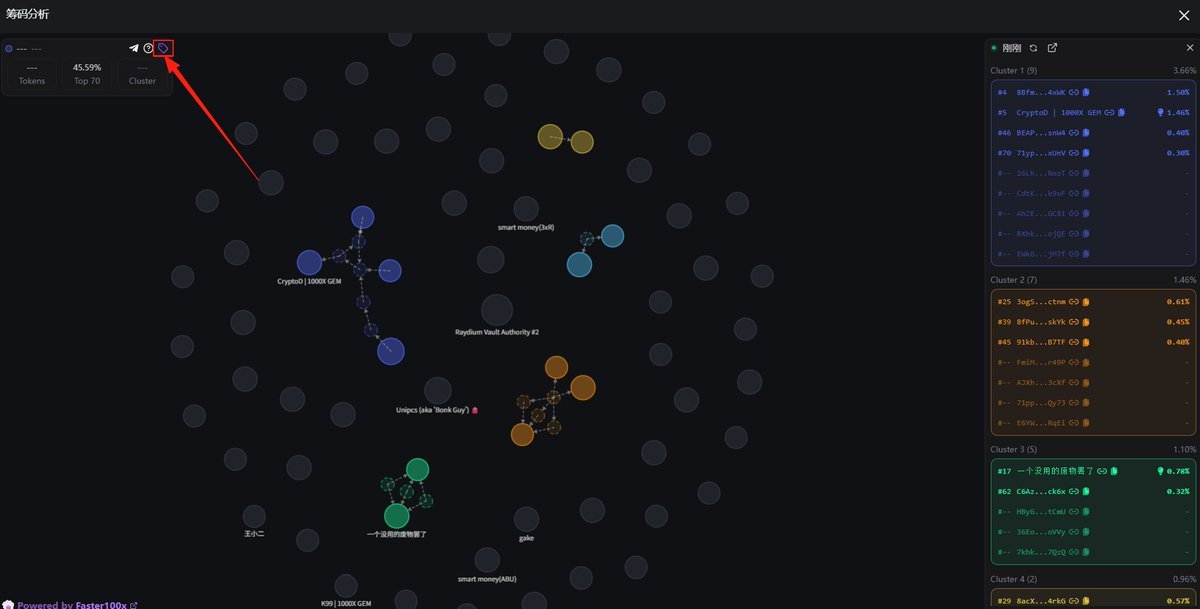
GMGN currently integrates the bubble map of Faster100X, which I think is the clearest at the moment, and can be viewed directly on the Kanban board.
The information provided by the bubble chart is actually very useful, it will directly show you all the clusters with funds associated with it, including the total percentage of holdings in the target cluster, etc.
Of course, just seeing such information is useless, but if you know the general truth that (a single cluster holding 5% of the total amount of tokens is completely enough to manipulate the price), this information will bring you a whole level of understanding of the market.
Note here: It is important to confirm that the cluster is owned by an individual, because in rare cases, it does not mean that the cluster is controlled by a single entity, although it appears to be the same cluster with financial linkage.
And when you turn on the tab function here, it will automatically show who most of the wallets belong to. For example, sometimes Lex or him, sometimes conspiracy wallets, will be marked directly for you.
2. The amount of currency held per capita
This is another very useful piece of information that I think is overlooked by many people.
Let's first talk about what the per capita amount of coins held can reflect:
The higher the per capita amount of coins, the higher the concentration of coin holdings, that is, most of the tokens are held in the hands of a few people.
The lower the per capita amount of coins, the lower the concentration of coin holdings, that is, most of the tokens are scattered in the hands of most people.
We all know that only fewer people and more tokens per capita can have a greater impact on the market. For example, if a person holds 100% of the coin, the price of the coin can easily rise 100 times and fall 100 times, and it is very easy for the currency price to achieve large fluctuations, which means that the opportunity will be greater.
But if 100 people with different views on this coin hold 1% each, then the fluctuations of this coin will be completely disordered and there will be no clear future.
In other words, the larger the data, the more likely it is that there will be concentrated forces to influence the price, which can also be understood as the more likely it is to have a banker.
So, if you are optimistic about the two coins, if you are hesitant about which of the two is better, looking at the amount of coins held by the two will help you make a decision.
Then let's talk about the wonderful use of the amount of currency held.
Under normal circumstances, the trend of the amount of coins held is highly convergent with the trend of the price. However, in very few cases, divergence will occur. For a market like the primary level, this phenomenon is very instructive.
For example, the per capita holding amount of this coin is almost the same at the two peaks of the red line.
But let's take a look at what the price looks like in this segment:
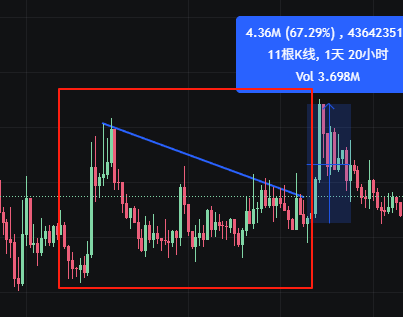
At the second peak, the per capita amount of coins held was unchanged from the previous peak, but the price was a full 21% lower. It reflects one thing: the price has fallen, but the per capita amount of coins held (the concentration of holdings has become higher than usual).
Then it means that at this time, more coins are collected by fewer people, that is, there is a greater possibility of someone accumulating funds, so the possibility of large fluctuations in the price of coins in the future also increases (and there is a high probability of rising), and sure enough, the subsequent price has risen by 67%.

3. K-Line Positioning Trading Function
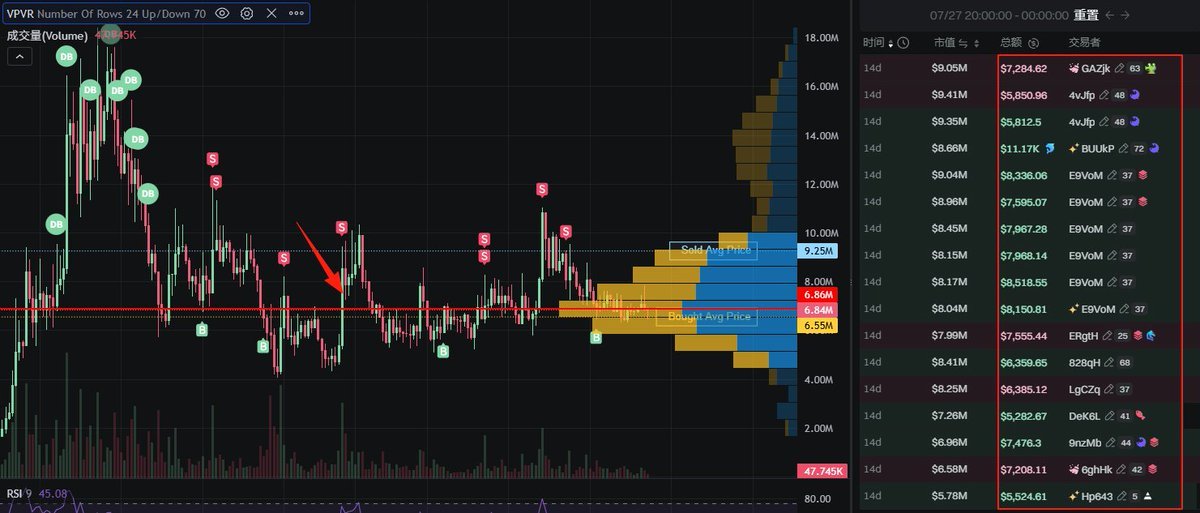
This function is very convenient and works well for anything. When you hold a token and notice a significant price fluctuation, you must check the reason behind it. The most direct way is to locate the corresponding K-line and examine the trading situation on that K-line. See who is involved and what they are doing. Is it large holders exiting, or is it suspected market manipulation?
By clicking on the corresponding K-line, all trading records for that K-line will be filtered out, and filtering for large transactions allows you to quickly obtain information on the reasons for price changes.
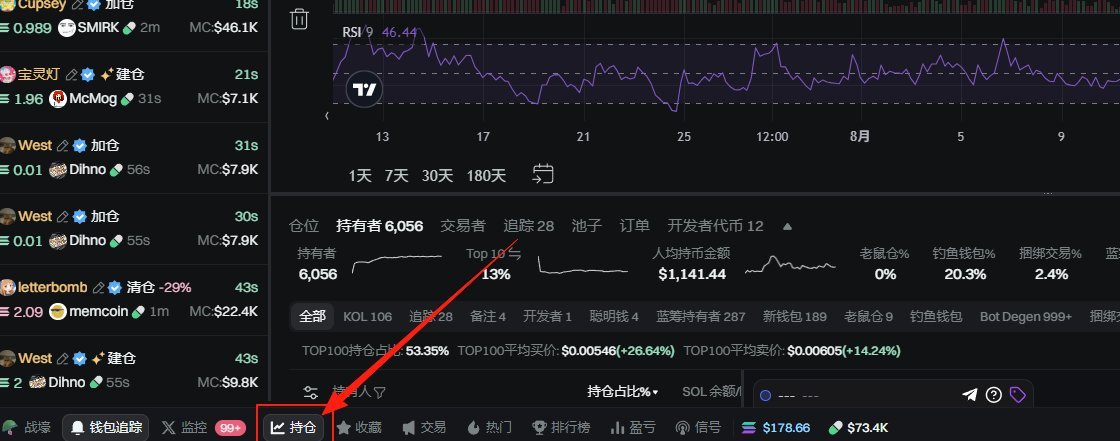
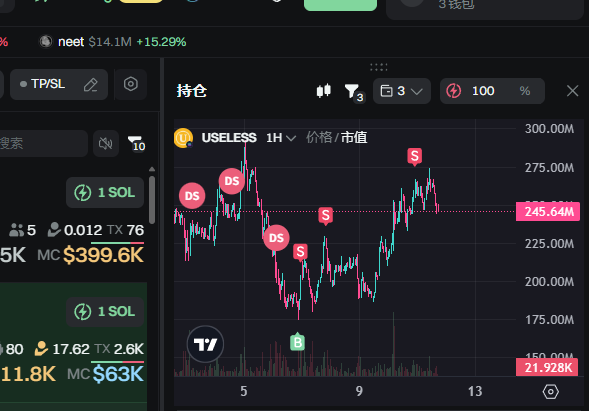
4. Real-time Display of Position K-Line
This display function is very useful. For example, if you are holding a token you are optimistic about but are trading other coins, and you want to keep an eye on the trend of the token you are optimistic about, this function perfectly solves the problem.
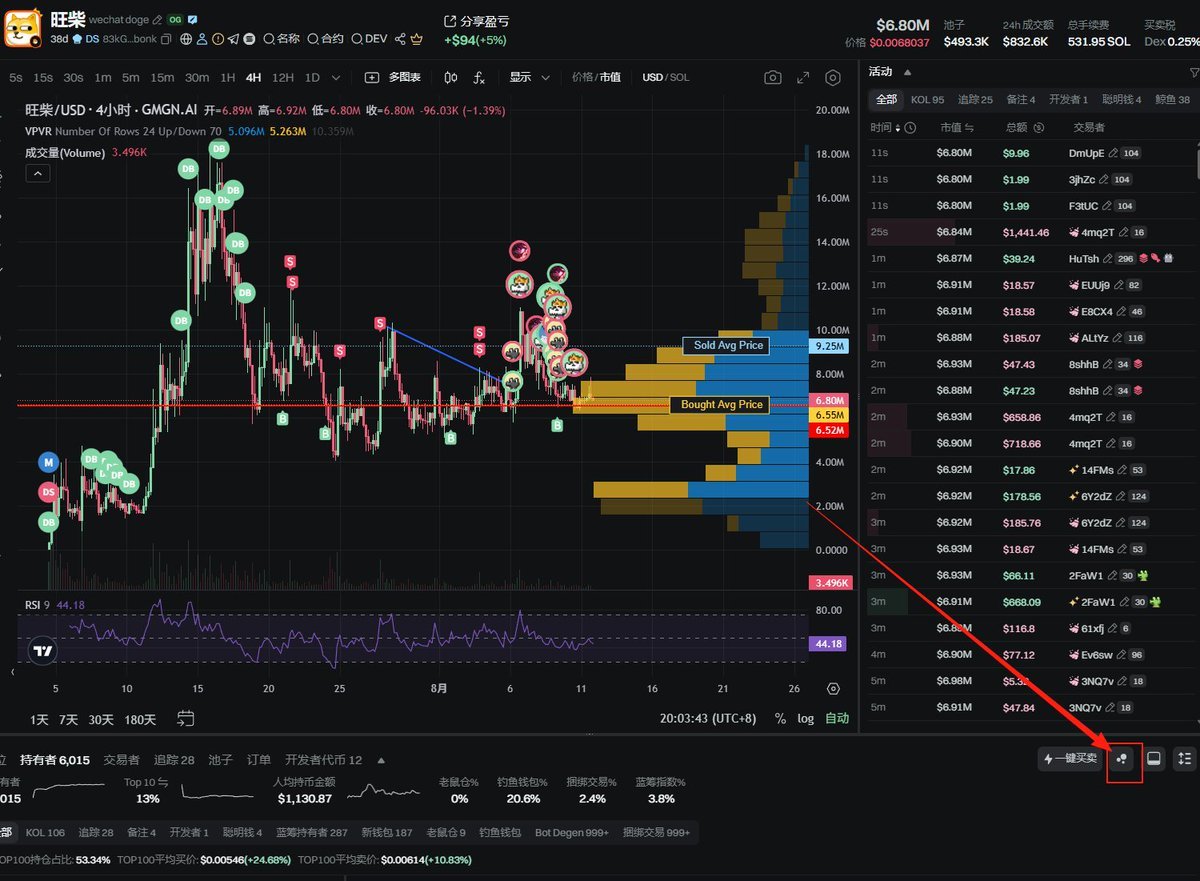
Open this function in the lower left corner.
Once opened, it can be docked to the far right, making the display very convenient.
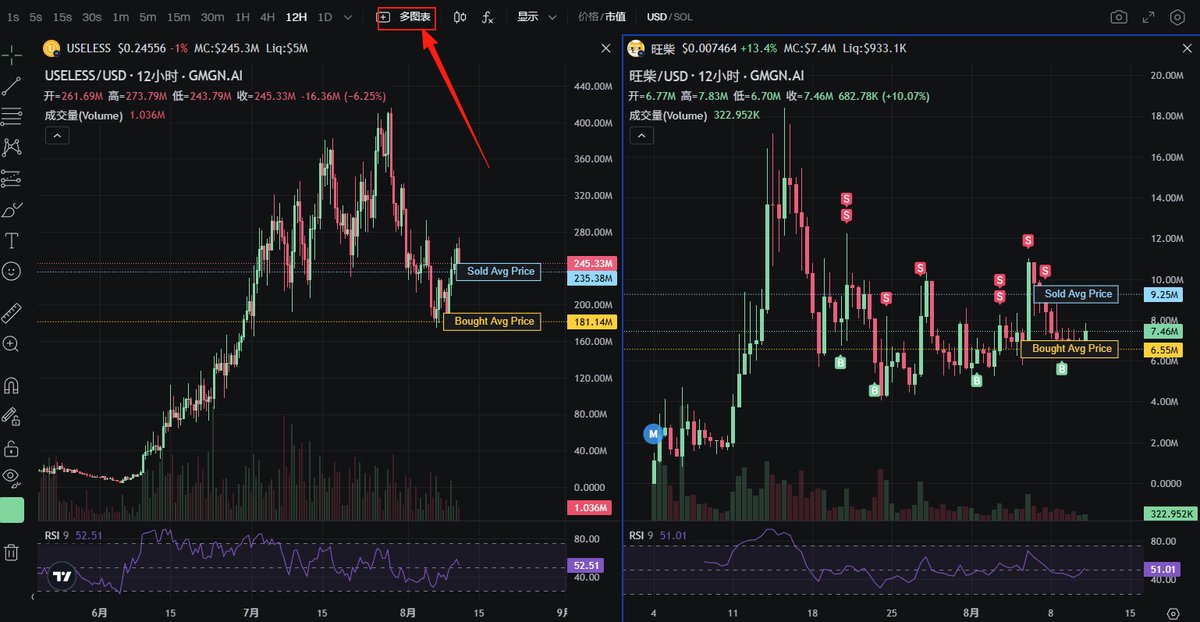
5. Multi-Chart and Dual-Currency Swap Trading Method
In many cases, I really like to use the dual-currency swap, which is very suitable for trading strategies involving large positions and long holds. At the same time, this method is also commonly used by hidden whales. The multi-chart function of GMGN enhances this method significantly.
Let me also explain the dual-currency swap method.
It's very simple. If you have two coins, A and B, that you are both optimistic about, you can:
1. First buy A and B.
2. If A rises compared to B, then exchange a portion of A for B.
3. Next, if A falls compared to B, then exchange a portion of B for A.
4. Repeat this cycle.
This can reduce your number of trades and gas fees by half while allowing you to trade A and B.
The benefit of this approach is that it can minimize the impact of extremely complex secondary SOL price fluctuations on your position (if your total position exceeds $10,000, then the price fluctuations of SOL can actually affect your position by more than $200 daily), while also saving half of the gas fees.
You can open this function as shown in the image.
6.47K
88
The content on this page is provided by third parties. Unless otherwise stated, OKX is not the author of the cited article(s) and does not claim any copyright in the materials. The content is provided for informational purposes only and does not represent the views of OKX. It is not intended to be an endorsement of any kind and should not be considered investment advice or a solicitation to buy or sell digital assets. To the extent generative AI is utilized to provide summaries or other information, such AI generated content may be inaccurate or inconsistent. Please read the linked article for more details and information. OKX is not responsible for content hosted on third party sites. Digital asset holdings, including stablecoins and NFTs, involve a high degree of risk and can fluctuate greatly. You should carefully consider whether trading or holding digital assets is suitable for you in light of your financial condition.

