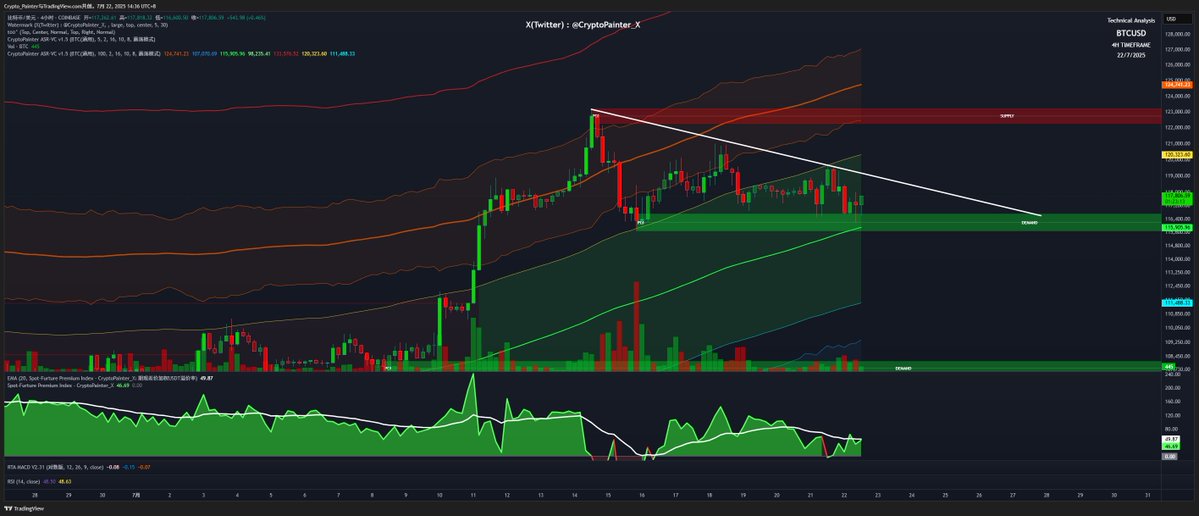
ASR-VC indicator 4h channel status update:
$BTC The 4h line officially tested the middle track of the channel last night, and the middle track is also the demand area for the first pullback on the left, at present, the support is effective, if you want to maintain the large-level bullish trend, the price needs to have the ability to get out of a higher high (120k);
On the other hand, the spot premium index is still at a low level, but it has rebounded, and it seems that it can be felt that a large amount of spot supply has been consumed after this wave of new highs.
The current idea has become very clear, as long as the price can be maintained above the middle track, it can continue to be bullish, and here it is completely possible to consider a false break below the middle track;
Because there is a lot of long liquidity at the 115k position, even if the price pin falls below the demand zone and the middle track, as long as it can be quickly recovered and does not confirm the breakdown, then it is a good long opportunity;
But if the price finally confirms that it has fallen below the middle track and comes out of the descending triangle in the figure, then the large-level bullish trend is completely over... The short-term target will be given along the blue line (112k) below the channel.
In short, trading is to gamble at the key position, the price is close to the middle track or the pin demand area, which is the so-called key position, you should bet, the big deal is to fall below the stop loss...

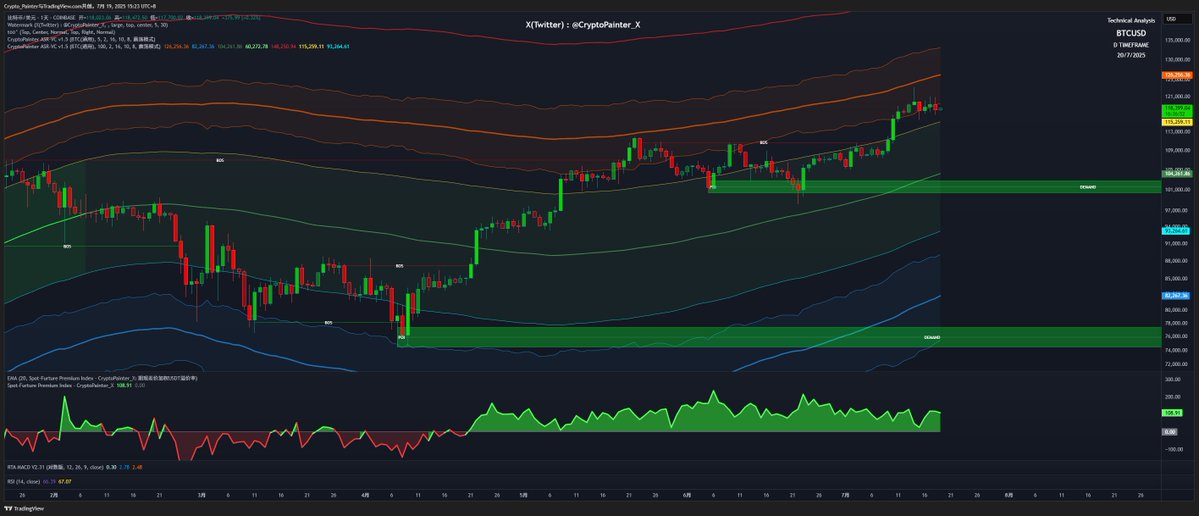
ASR-VC indicator daily channel status update:
As usual, let's check the daily channel status every Saturday! Currently, $BTC is moving steadily, with a large-scale bullish trend still being maintained, and no structural damage. After the price entered the average resistance level, it began to fluctuate;
From a time perspective, it is expected that next week there will be some attempts to test the upper and lower bounds of the range.
Since this wave of price action has not effectively broken through the orange line, it can still be determined that this trend is currently still a regular bullish trend at the daily level and has not upgraded to a strong bullish trend at the weekly level.
Next, we will see if the following two weeks can continue to extend the new daily rally. If it breaks out, it will transition from the daily level to the weekly level; if it doesn't break out, the structure here will likely replicate the left-side price rally to the orange average resistance zone.
In other words, it will be a long-term range market with fluctuations + pullbacks.
So boring~ so boring!

26.49K
48
The content on this page is provided by third parties. Unless otherwise stated, OKX is not the author of the cited article(s) and does not claim any copyright in the materials. The content is provided for informational purposes only and does not represent the views of OKX. It is not intended to be an endorsement of any kind and should not be considered investment advice or a solicitation to buy or sell digital assets. To the extent generative AI is utilized to provide summaries or other information, such AI generated content may be inaccurate or inconsistent. Please read the linked article for more details and information. OKX is not responsible for content hosted on third party sites. Digital asset holdings, including stablecoins and NFTs, involve a high degree of risk and can fluctuate greatly. You should carefully consider whether trading or holding digital assets is suitable for you in light of your financial condition.

