#mubarak
Leave the analysis to me, I'll handle the stress of monitoring the market. You just need to turn on the notification bell to see the analysis and conclusions!
I noticed that everyone's attention on the secondary market is still focused on the few tokens that have recently launched on BSC. Let's analyze the data of #mubarak! There's not much else to analyze; the sentiment for this token's trend isn't in place, and the other MEMEs won't rise either!
BTC and ETH updates will come later, let's focus on #MubaraK first.
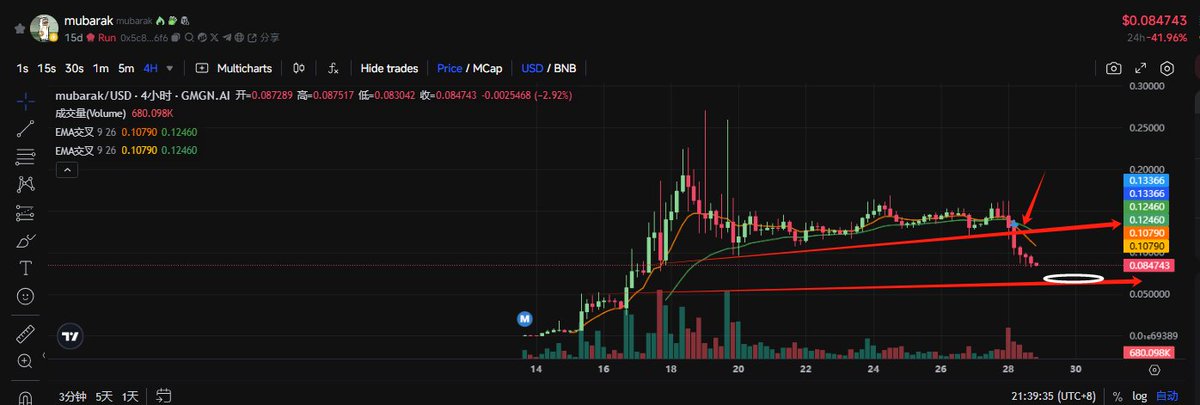
图1
K-line structure: Currently breaking down. As mentioned in previous analyses, breaking the 0.126 trend will disrupt it. After the trend is disrupted, don't try to catch the bottom in the short term!
Currently, the support structure is shown in 图1, with an effective support point at a market cap of 71 million (0.071). You can pay attention to the support at this position. I will observe and buy based on indicator data at this position!
(Despite this drop, I personally believe it's largely due to the concentration of new listings causing a collapse in market confidence, turning bulls into bears. Holders see the market's upward movement being obstructed, pressure increasing, and follow suit by shorting for arbitrage, slowly selling off spot holdings to lock in profits.)
The reason for saying this is because the long-short ratio indicator and the number of retail investors trying to catch the bottom have been cumulatively increasing after the drop.
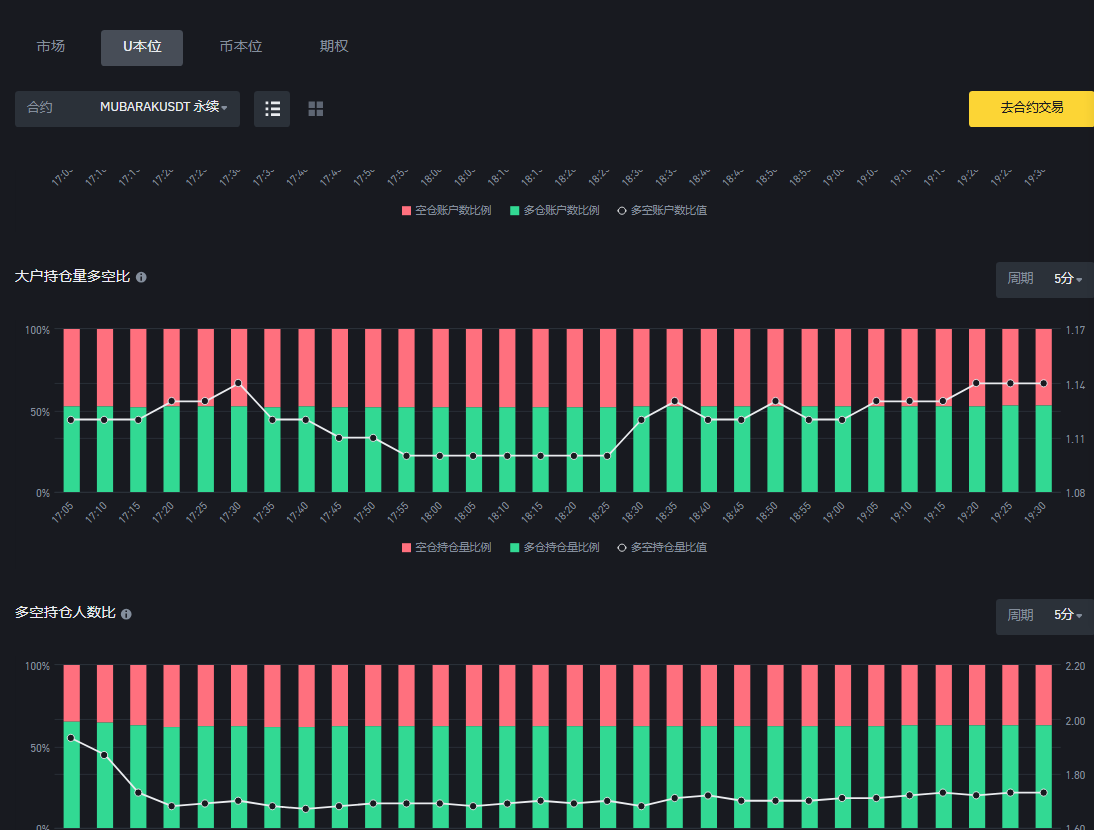
图2
(Since 3 PM on March 27, the long-short ratio of holders has remained around 1.21, with a relatively balanced value of 47% short positions and 53% long positions. Starting from 8 PM on March 27, the long-short ratio began to become unbalanced. Notably, before 8 PM, there was a slight increase of 8%, dropping to around 0.142 and then stabilizing, with the long-short ratio cumulatively increasing to 1.43.)
Around 2 AM, the main market-making funds began to push up short positions, with a surge in large holders' short positions, leading to a rapid increase in the short ratio. There was a concentrated liquidation of long positions at midnight! After liquidating the longs, the main force continued to increase the short ratio of large holders' positions, with the highest long-short ratio of large holders' positions at 1.3 and an average of 1.2. The position volume didn't change much! Thus, it can be judged that the market's long positions were liquidated, and the main force increased their positions!
From the data structure, from 11 AM to around 8 PM today, retail investors concentrated on catching the bottom, with the long-short position ratio reaching 1.72. The average ratio during this period was 1.75, with a maximum of 1.9.
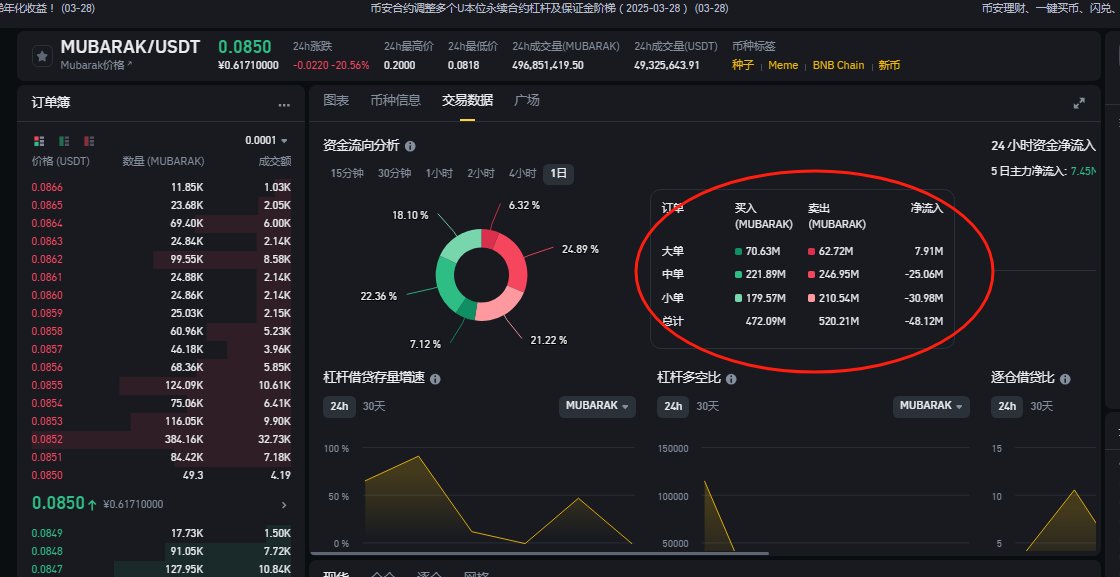
看图3
Notably, looking at the data of today's spot launch, there was a large buy and small sell, with medium and small orders covering large buy orders, resulting in a net outflow of 48M. This data isn't bad! After all, it's a newly launched spot trading MEM token!
Comprehensive analysis: The data indicates that the main force started to flatten short positions during the day today. The spot data shows that the main force hasn't sold off significantly. The current sell data may just be for flattening short positions through volatile trading! Based on the current long-short position ratio and position volume data, it still needs to be polished for the next two days. It's recommended to observe tomorrow and decide on buying opportunities the day after tomorrow! The effective support point currently visible is around 0.071+.
Not to be used as a trading basis, for communication and reference only!


说出你想看的品种,或者大盘综合复盘分析!
分析交给我,盯盘煎熬我来扛,你们只需要打开小铃铛,看分析和结论即可!
两天没看盘,跌成狗屎,乱象丛生!
心里反向一想,
现在的币圈,反正当成泡沫资产在炒。不如消费掉,所以买了个本子,只为方便复盘!
现在复盘,晚上加更!
3.27万
79
本页面内容由第三方提供。除非另有说明,欧易不是所引用文章的作者,也不对此类材料主张任何版权。该内容仅供参考,并不代表欧易观点,不作为任何形式的认可,也不应被视为投资建议或购买或出售数字资产的招揽。在使用生成式人工智能提供摘要或其他信息的情况下,此类人工智能生成的内容可能不准确或不一致。请阅读链接文章,了解更多详情和信息。欧易不对第三方网站上的内容负责。包含稳定币、NFTs 等在内的数字资产涉及较高程度的风险,其价值可能会产生较大波动。请根据自身财务状况,仔细考虑交易或持有数字资产是否适合您。

