$BTC / $USDT - TA OTD 📊
Time flies; it seems like just yesterday, but we're already far away from the last halving event.
It's time to update the cycle theory and see if we can time some important phases using the charts.
Pay attention and follow me
👇
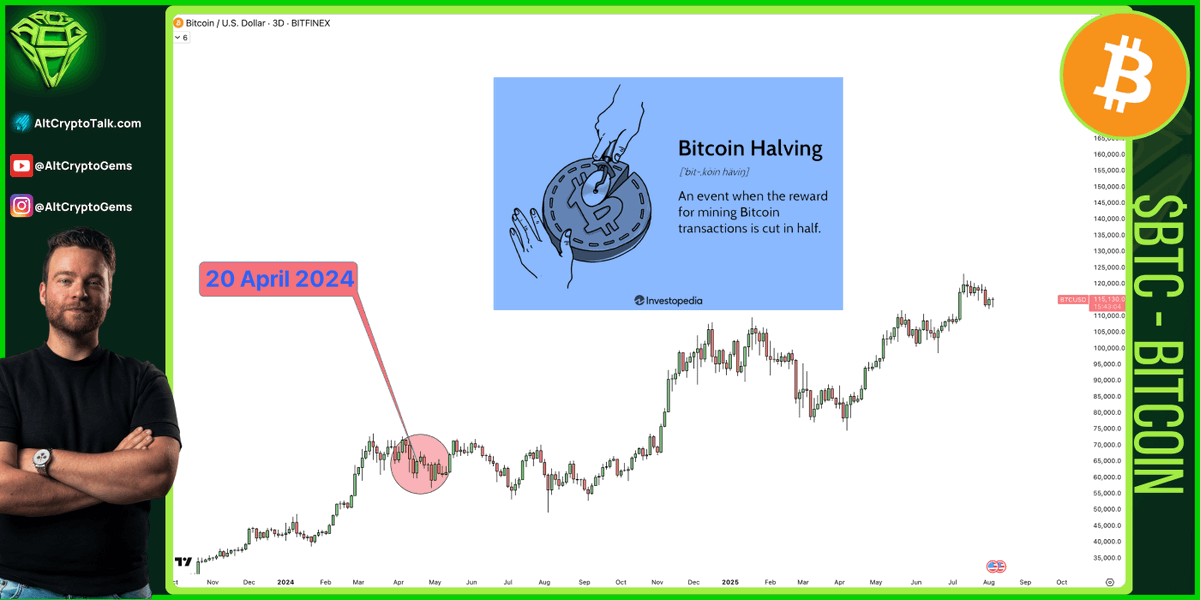
As you know, the halving event occurs approximately every four years, and during each halving, the reward for mining $BTC is cut in half.
Basically, the supply flow of #Bitcoin is reduced, usually positively impacting the price, which increases as demand rises.
Less supply, same or more demand, price goes up!
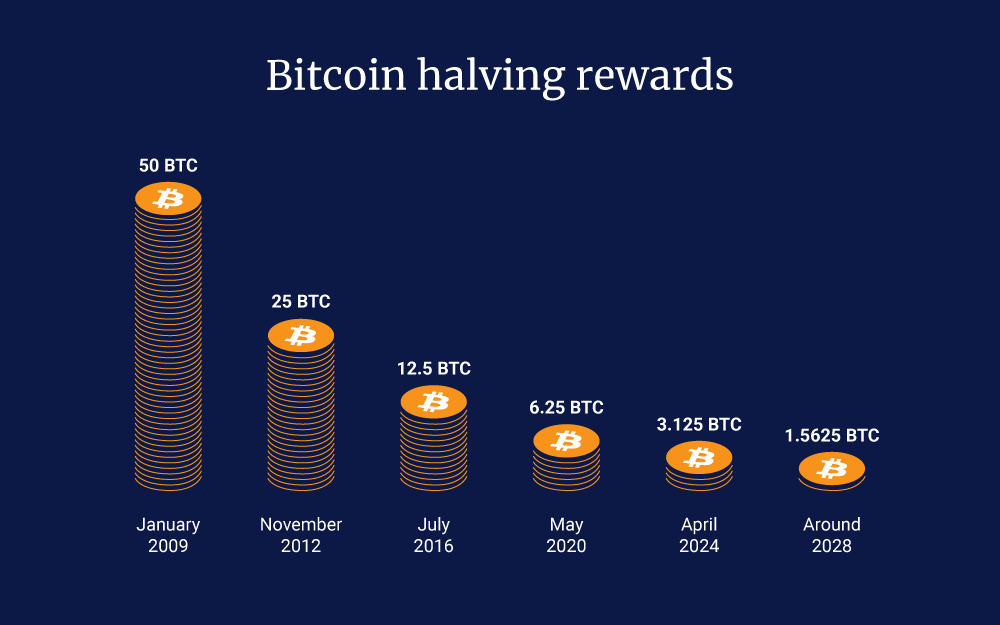
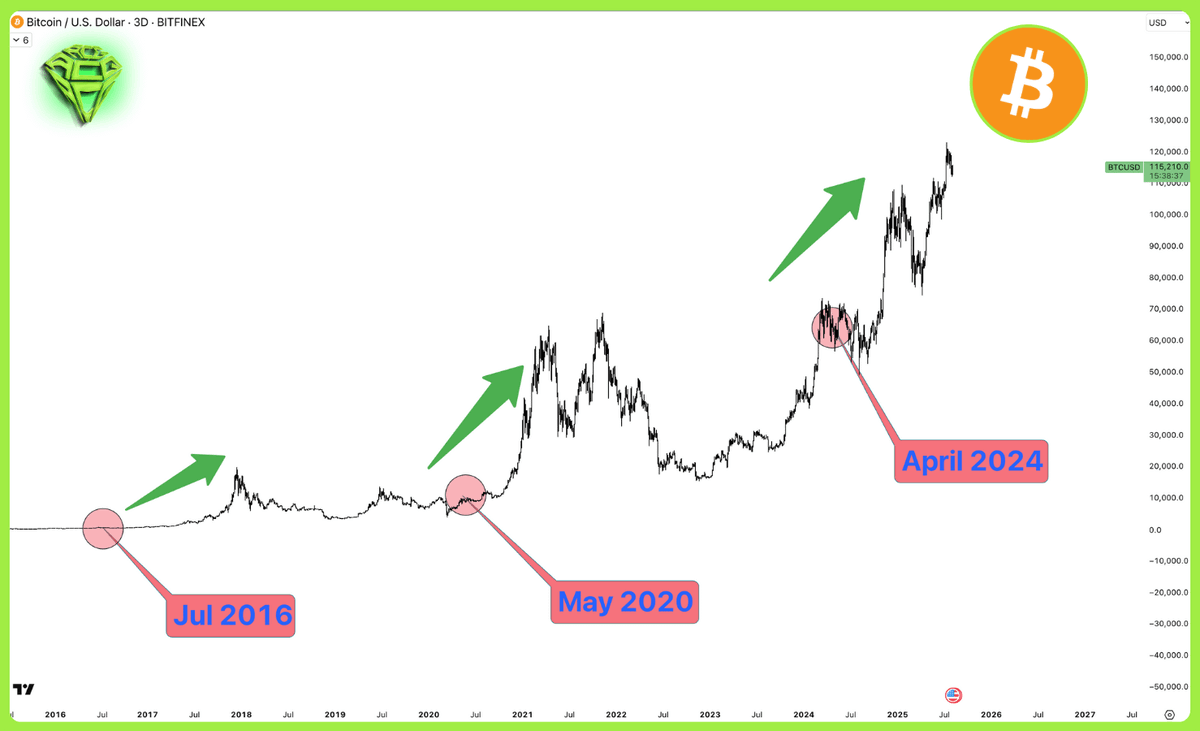
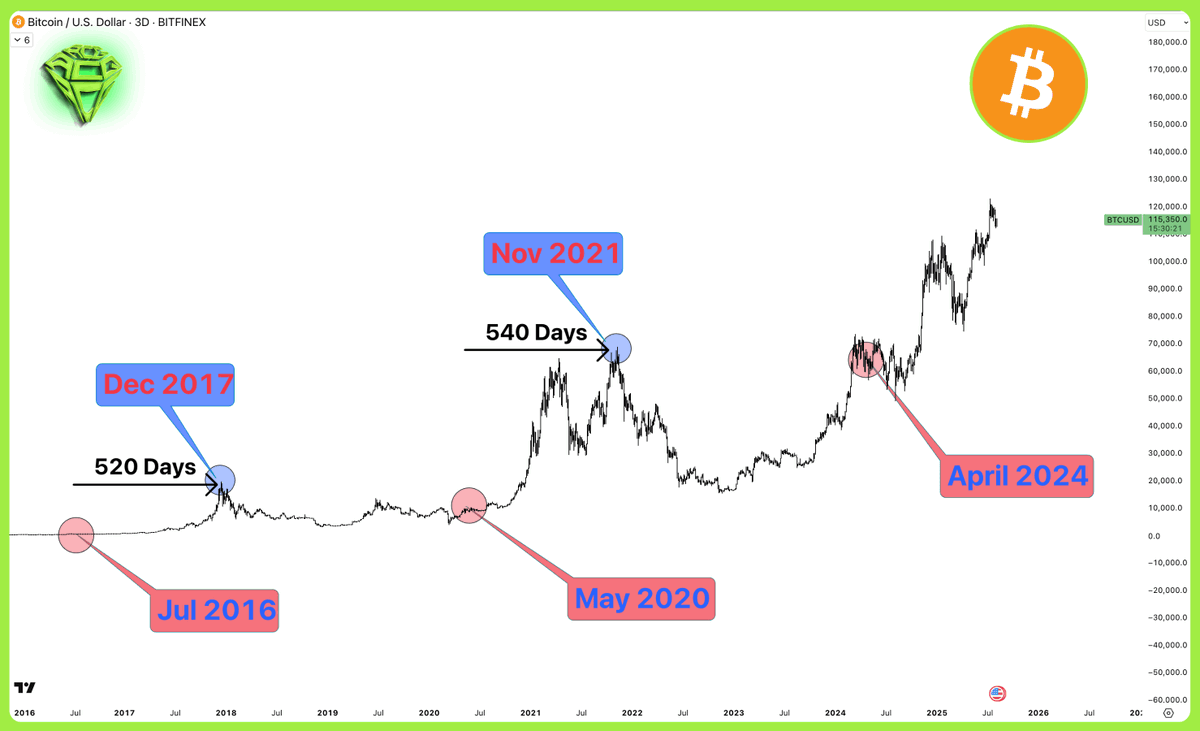
This concept is easily seen in the chart of $BTC. As you can see, price has historically moved up after the halving, making it a good level to buy and accumulate.
But can we use the halving also to time a potential cycle top?
Well, probably yes!
As shown in the chart, after each halving we had a prolonged period of upward price action, but every cycle has recorded a key top level for the bull market that marked the beginning of the bear market.
So let's use two simple metrics to try to calculate where the current cycle top can occur.
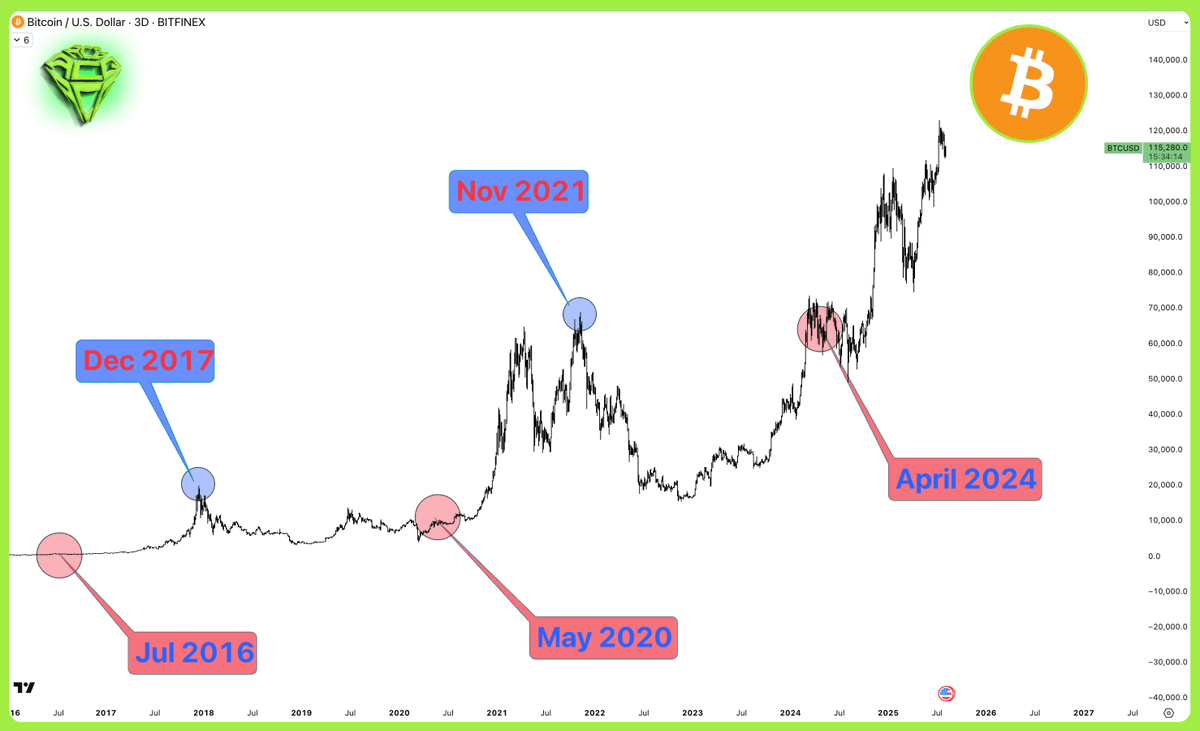
The first metric is time distance.
If we look at the distance between the halving and the cycle top, we can see that the distance is practically always identical; around 520 to 540 days separates the two events.
Pretty impressive coincidence, right?
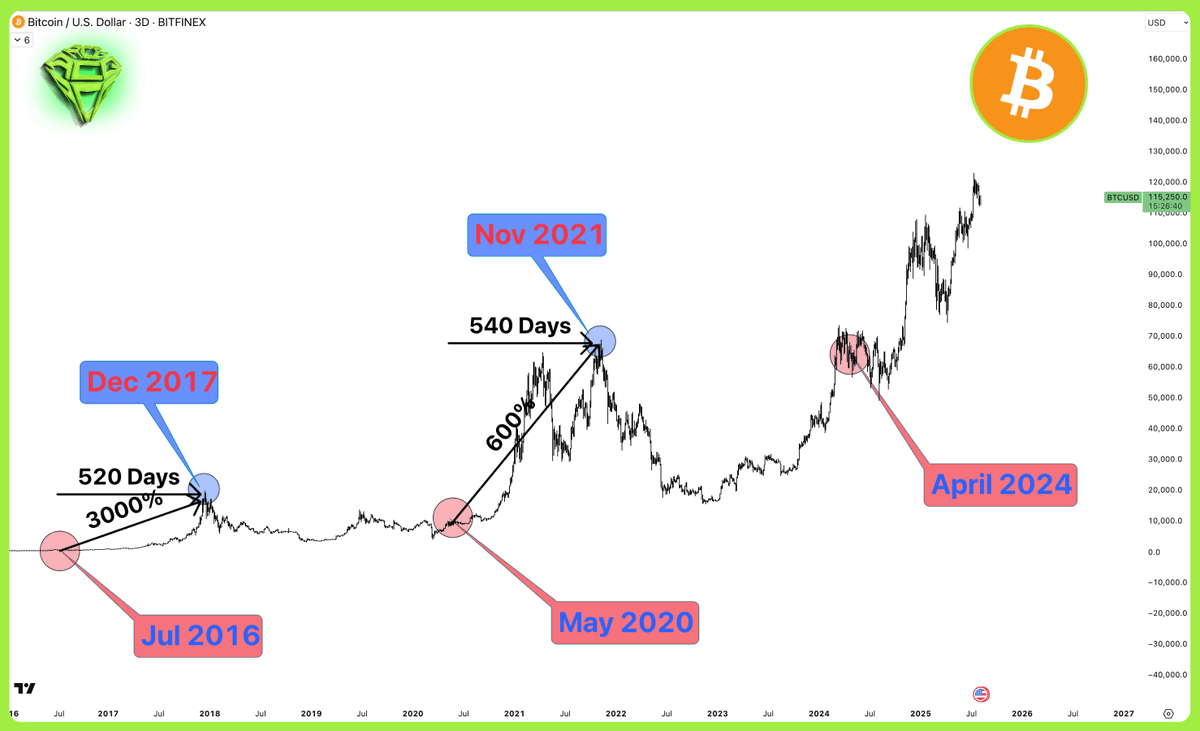
The second metric we can monitor is the price distance between the halving and cycle top.
As you can see, considering the last two halving events, we went from 3000% to 600%. That's pretty normal due to the increase in market cap of $BTC.
Here we can extrapolate an important number: every cycle, the price increase of $BTC decreases by 5X (3000% to 600%).
So with these metrics in our hand, let's try to predict when and where this cycle $BTC will top.
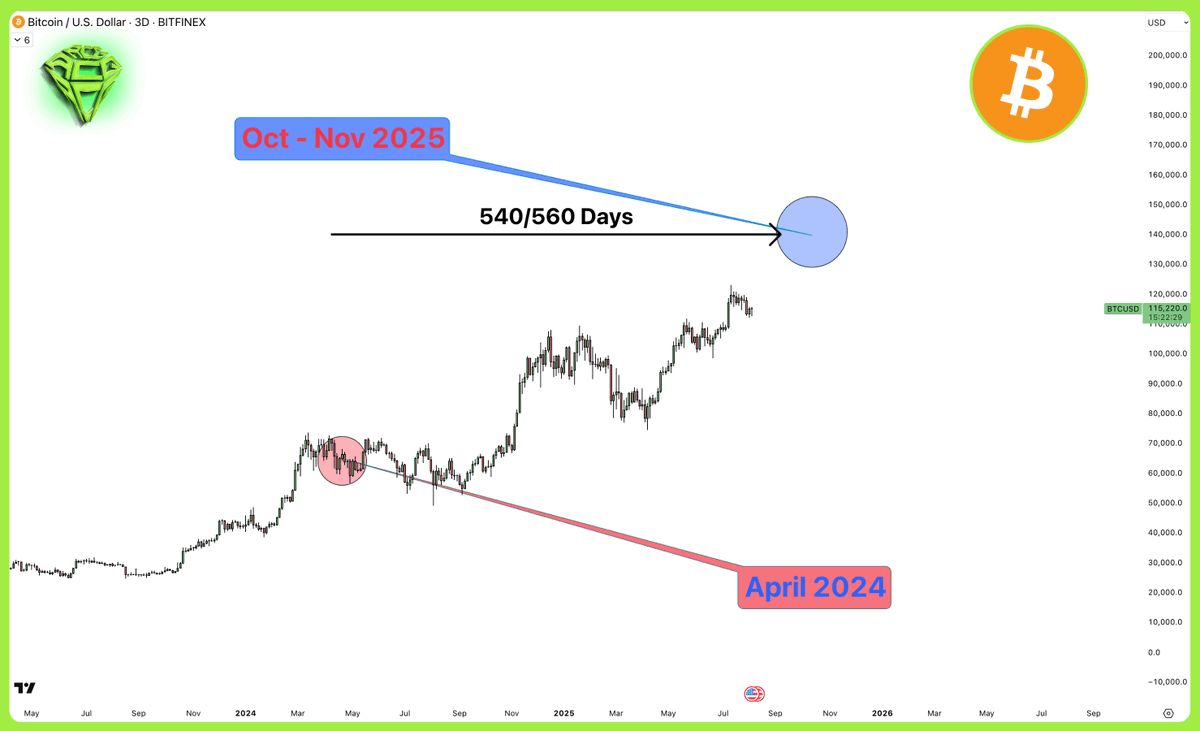
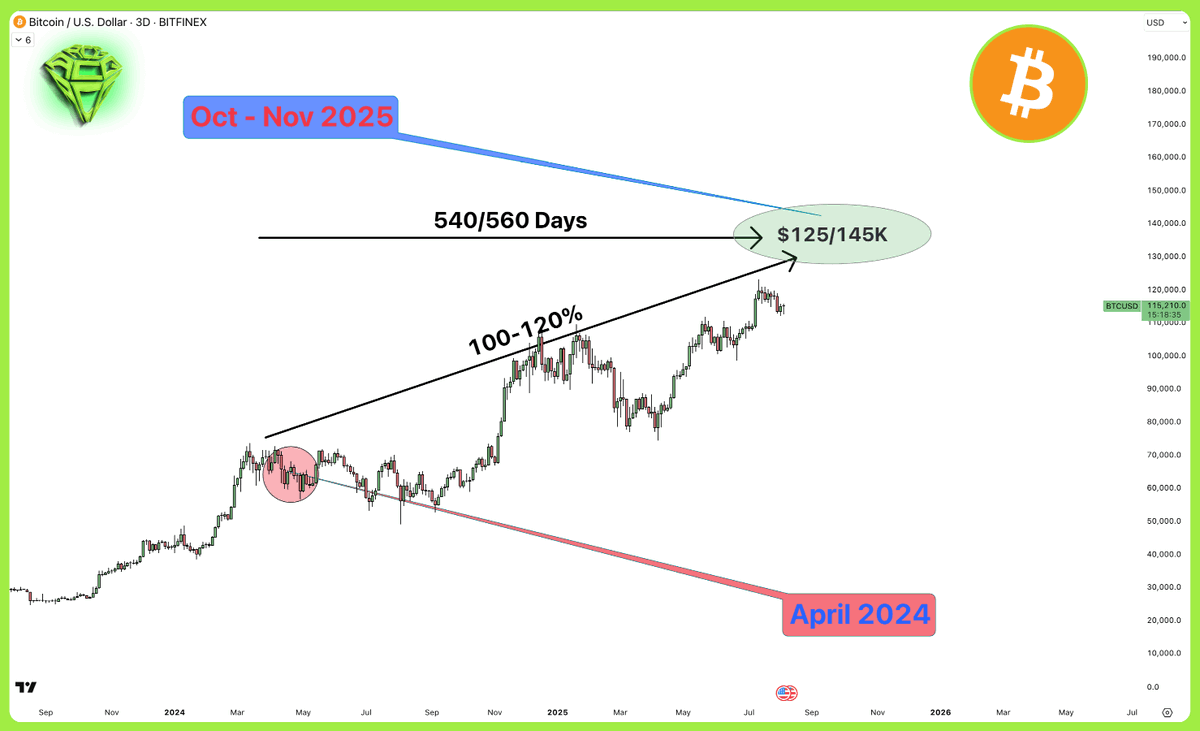
First, let's use the time distance by adding 540 to 560 days to April 2024.
Well, the result is pretty worrying, as we might expect to have a cycle top in October and November 2025. Just a few months from now.
Secondly, let's apply the price distance and use our ratio of dividing the latest price returns of 600% by 5.
So we get a potential return of approximately $125,000 to $145,000 for 1 BTC. Again, not that far from the current price!
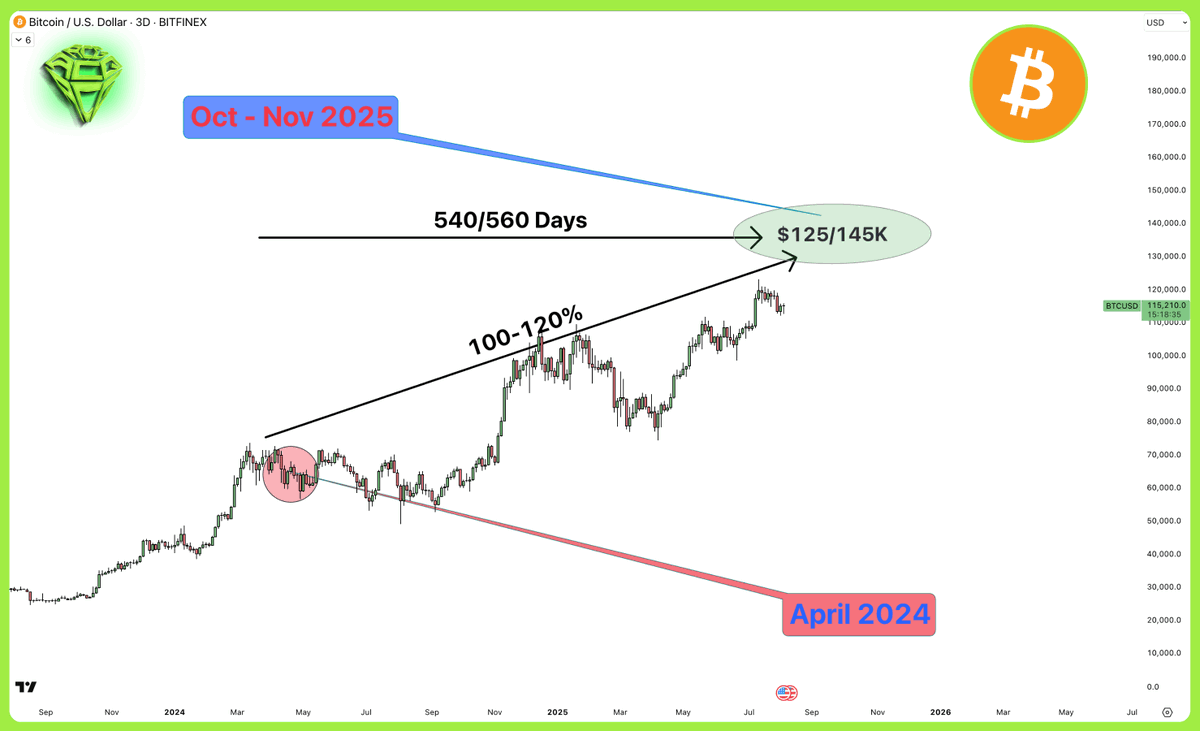
While past price action cannot guarantee anything about future prices, it is important to consider this data and keep it in mind.
I am very curious to know: should we approach the $125 to 145K level in October or November, what would be your strategy?
That's it for today.
And remember, nothing in this thread is financial advice; all my content is for educational purposes only!
If you like this thread 🧵, hit that like ❤️ button and repost the first message!
107.43K
943
The content on this page is provided by third parties. Unless otherwise stated, OKX is not the author of the cited article(s) and does not claim any copyright in the materials. The content is provided for informational purposes only and does not represent the views of OKX. It is not intended to be an endorsement of any kind and should not be considered investment advice or a solicitation to buy or sell digital assets. To the extent generative AI is utilized to provide summaries or other information, such AI generated content may be inaccurate or inconsistent. Please read the linked article for more details and information. OKX is not responsible for content hosted on third party sites. Digital asset holdings, including stablecoins and NFTs, involve a high degree of risk and can fluctuate greatly. You should carefully consider whether trading or holding digital assets is suitable for you in light of your financial condition.

