Why is this bull market different from the past? Six charts reveal the drivers of Bitcoin's rally
Original Title: These Six Charts Explain Why Bitcoin's Recent Move to Over $100K May Be More Durable Than January's Run
Original Author: OMKAR GODBOLE
Original compilation: Ismay, BlockBeats
Editor's note: Bitcoin's breakthrough on Pizza Day was like a celebratory gift from fate to the crypto market. But unlike previous bull markets, this new Bitcoin high is just a carnival for BTC alone, and the altcoin market has not risen much. This article explains why Bitcoin's recent break above $100,000 may be more sustained than January's rally. Key indicators such as financial conditions and stablecoin inflows show that the basis for this round of gains is more solid than the "double top" market from December last year to January this year.
The key messages are as follows:
Bitcoin is currently trading above $100,000, and the market environment suggests that the basis for this rally is more solid than the "double top" market from December last year to January this year;
The current financial environment, stablecoin inflows, and the performance of spot ETFs are all more favourable to Bitcoin than before;
Other key indicators also show no signs of overheating and speculative sentiment at the end of the year and the beginning of the year.
Bitcoin's current price is $106,546.31, regaining its foothold at the $100,000 mark. As investors tend to be susceptible to "near-term biases", many may assume that this move will be a repeat of the period from December last year to January of this year, when the upward momentum quickly waned and the price quickly fell back into the six-digit range, eventually falling back to $75,000 at one point.
However, looking at the next six charts, the current Bitcoin market appears to be more robust than it was in December-January, which means that the likelihood of further upside is also higher.
"Financial conditions" refer to a range of economic variables, including interest rates, inflation, credit availability and market liquidity, which are often influenced by macro indicators such as the yield on benchmark Treasury bonds (e.g. the US 10-year Treasury yield) and the US dollar exchange rate.
Tight financial conditions will dampen risk appetite in financial markets and the real economy, while accommodative conditions will encourage more risky investment behaviour. As of now, the current financial conditions are significantly looser than in January this year, judging by the 10-year US Treasury yield and the US dollar index, which is conducive to the continued rise of bitcoin.
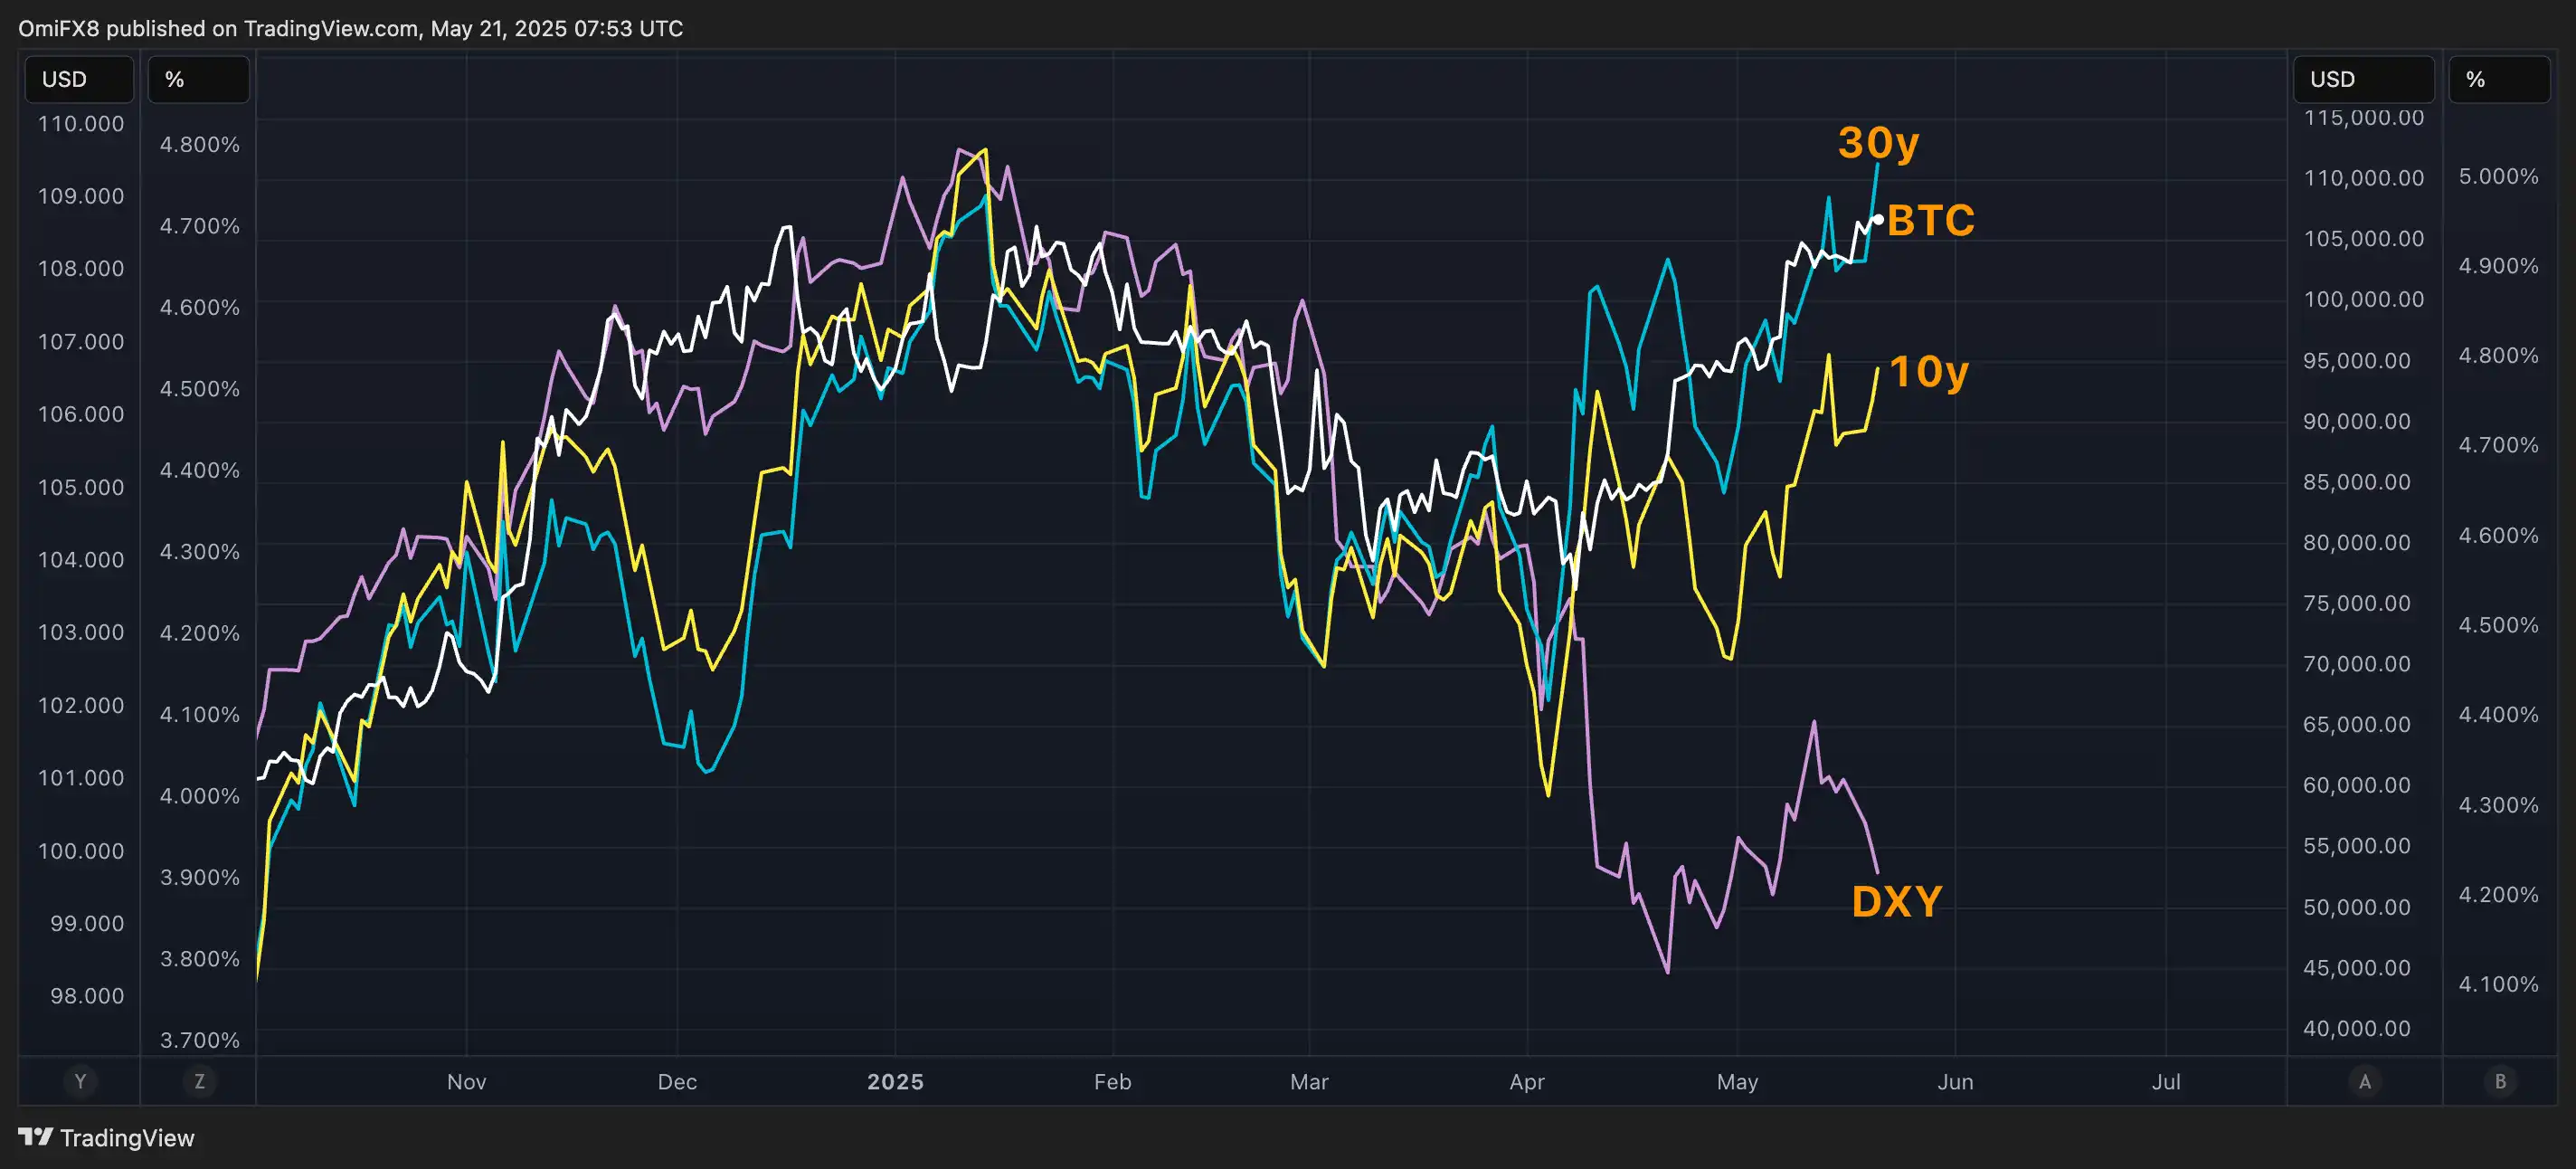
At the time of publication, the dollar index, which measures the greenback against a basket of major currencies, was trading at 99.60, down 9% from its January high of 109.00. The US 10-year Treasury yield stood at 4.52%, down 30 basis points from its January high of 4.8%.
While the 30-year Treasury yield has risen above 5%, back to January levels, it is widely seen as a positive for Bitcoin and gold.
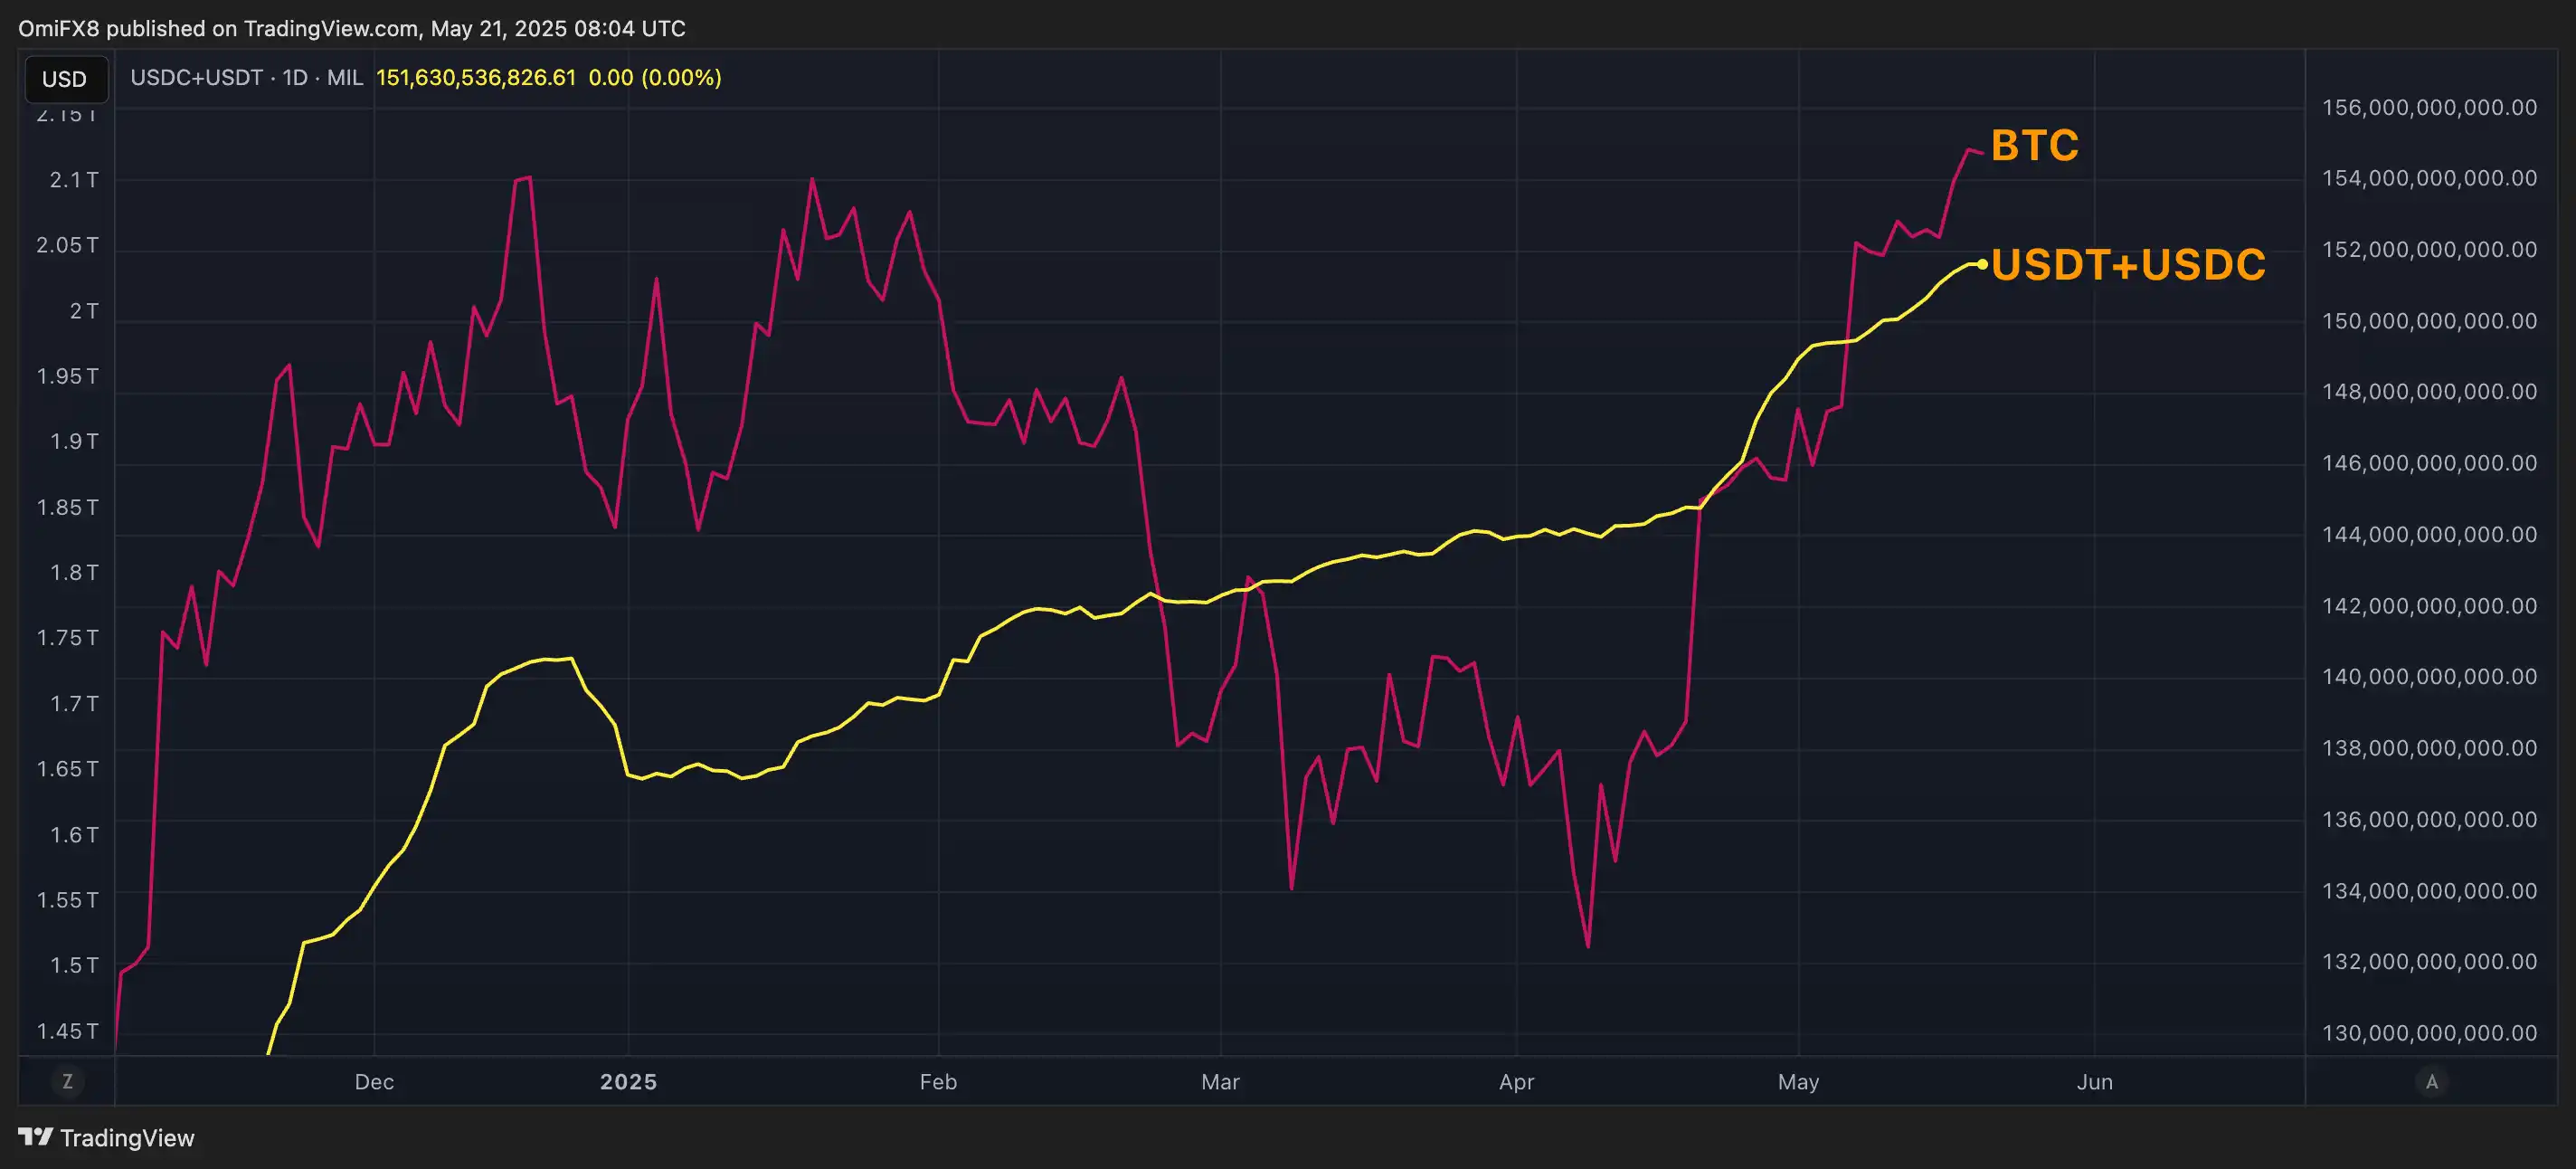
There is also "dry powder" in the market
The combined market capitalisation of the two largest dollar-denominated stablecoins – USDT and USDC – has reached a record $151 billion. According to TradingView, this value is nearly 9% higher than the average market capitalisation ($139 billion) from December last year to January this year.
In other words, there is now more "dry powder" in the market – that is, potential funds that can be used to invest in Bitcoin and other crypto assets.
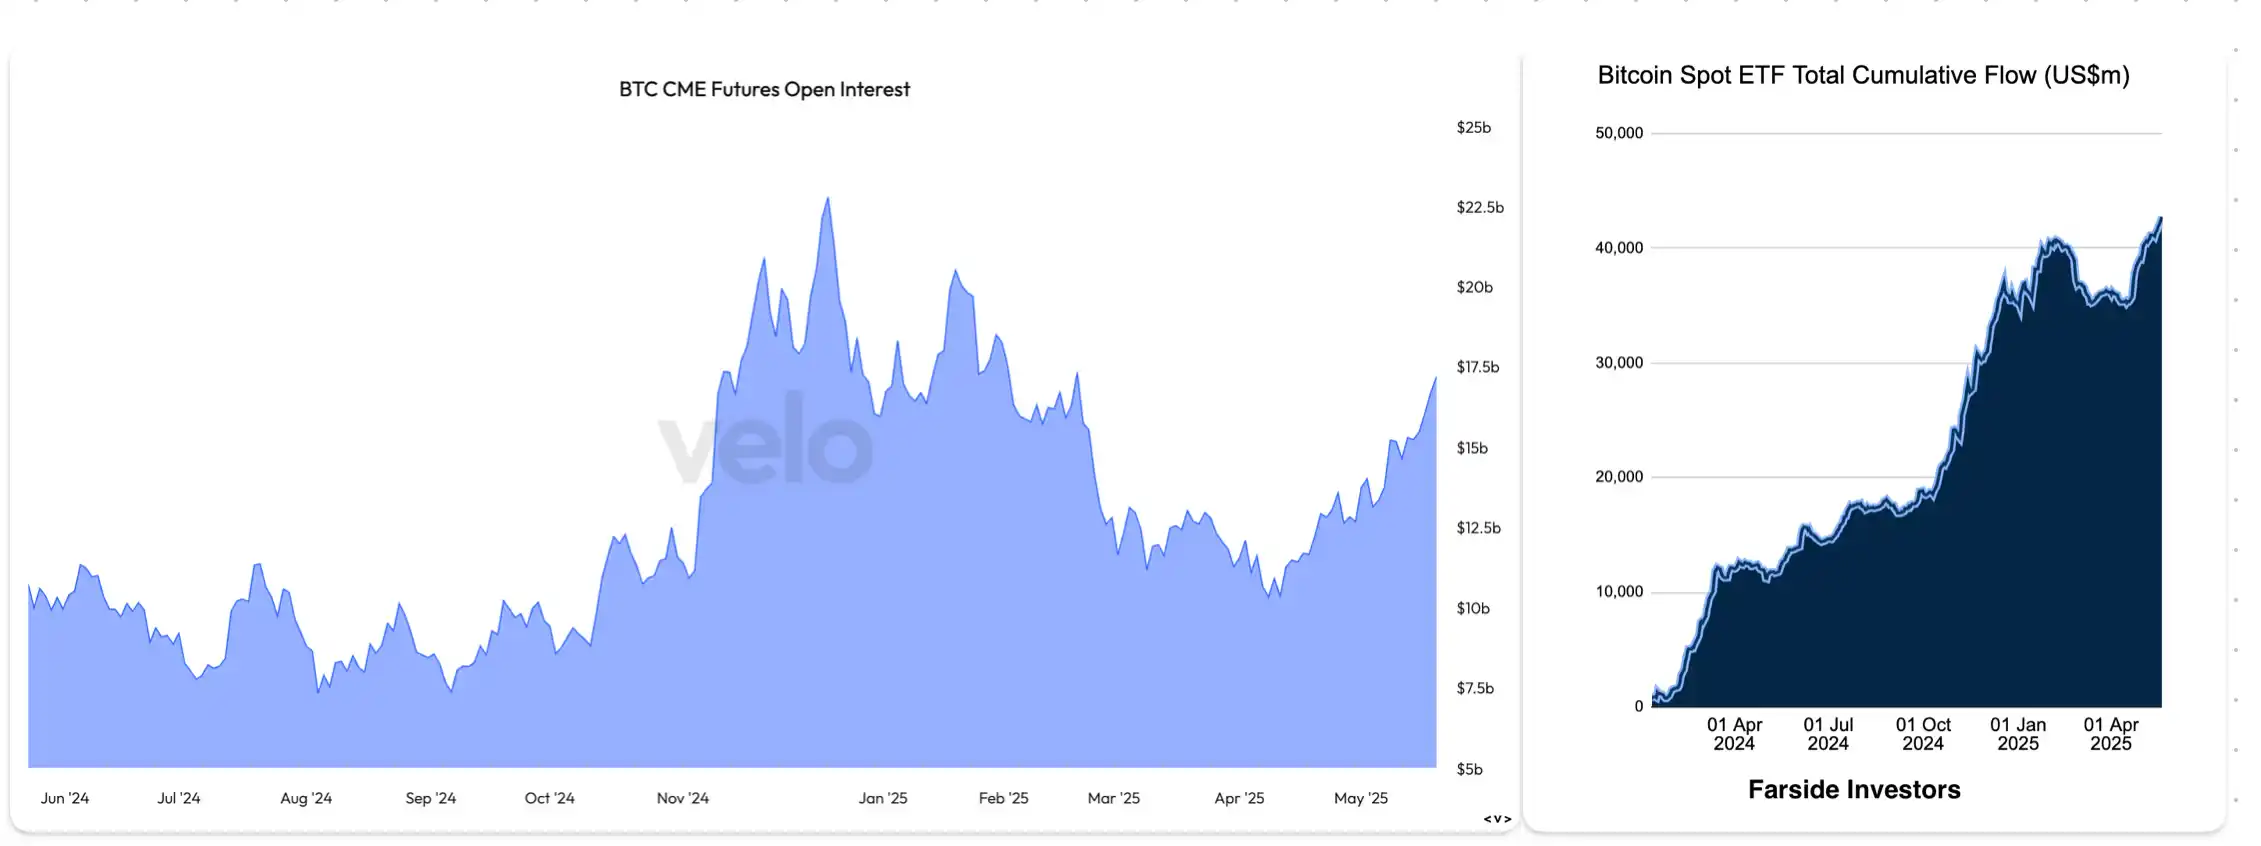
Strong directional bets
Since Bitcoin rebounded from a low near $75,000 in early April, the rally has been largely dominated by institutions, with bets on long rather than arbitrage.
This can be seen in two ways: US-listed spot bitcoin ETFs continue to attract significant inflows, and CME Bitcoin futures open interest remains relatively modest.
According to data source Velo, CME Bitcoin futures notional open interest has climbed to $17 billion, the highest since Feb. 20. However, this figure is still significantly lower than the peak of $22.79 billion in December last year.
Instead, according to Farside Investors, the cumulative inflows into the current 11 spot Bitcoin ETFs have reached a record $42.7 billion, up from $39.8 billion in January this year.
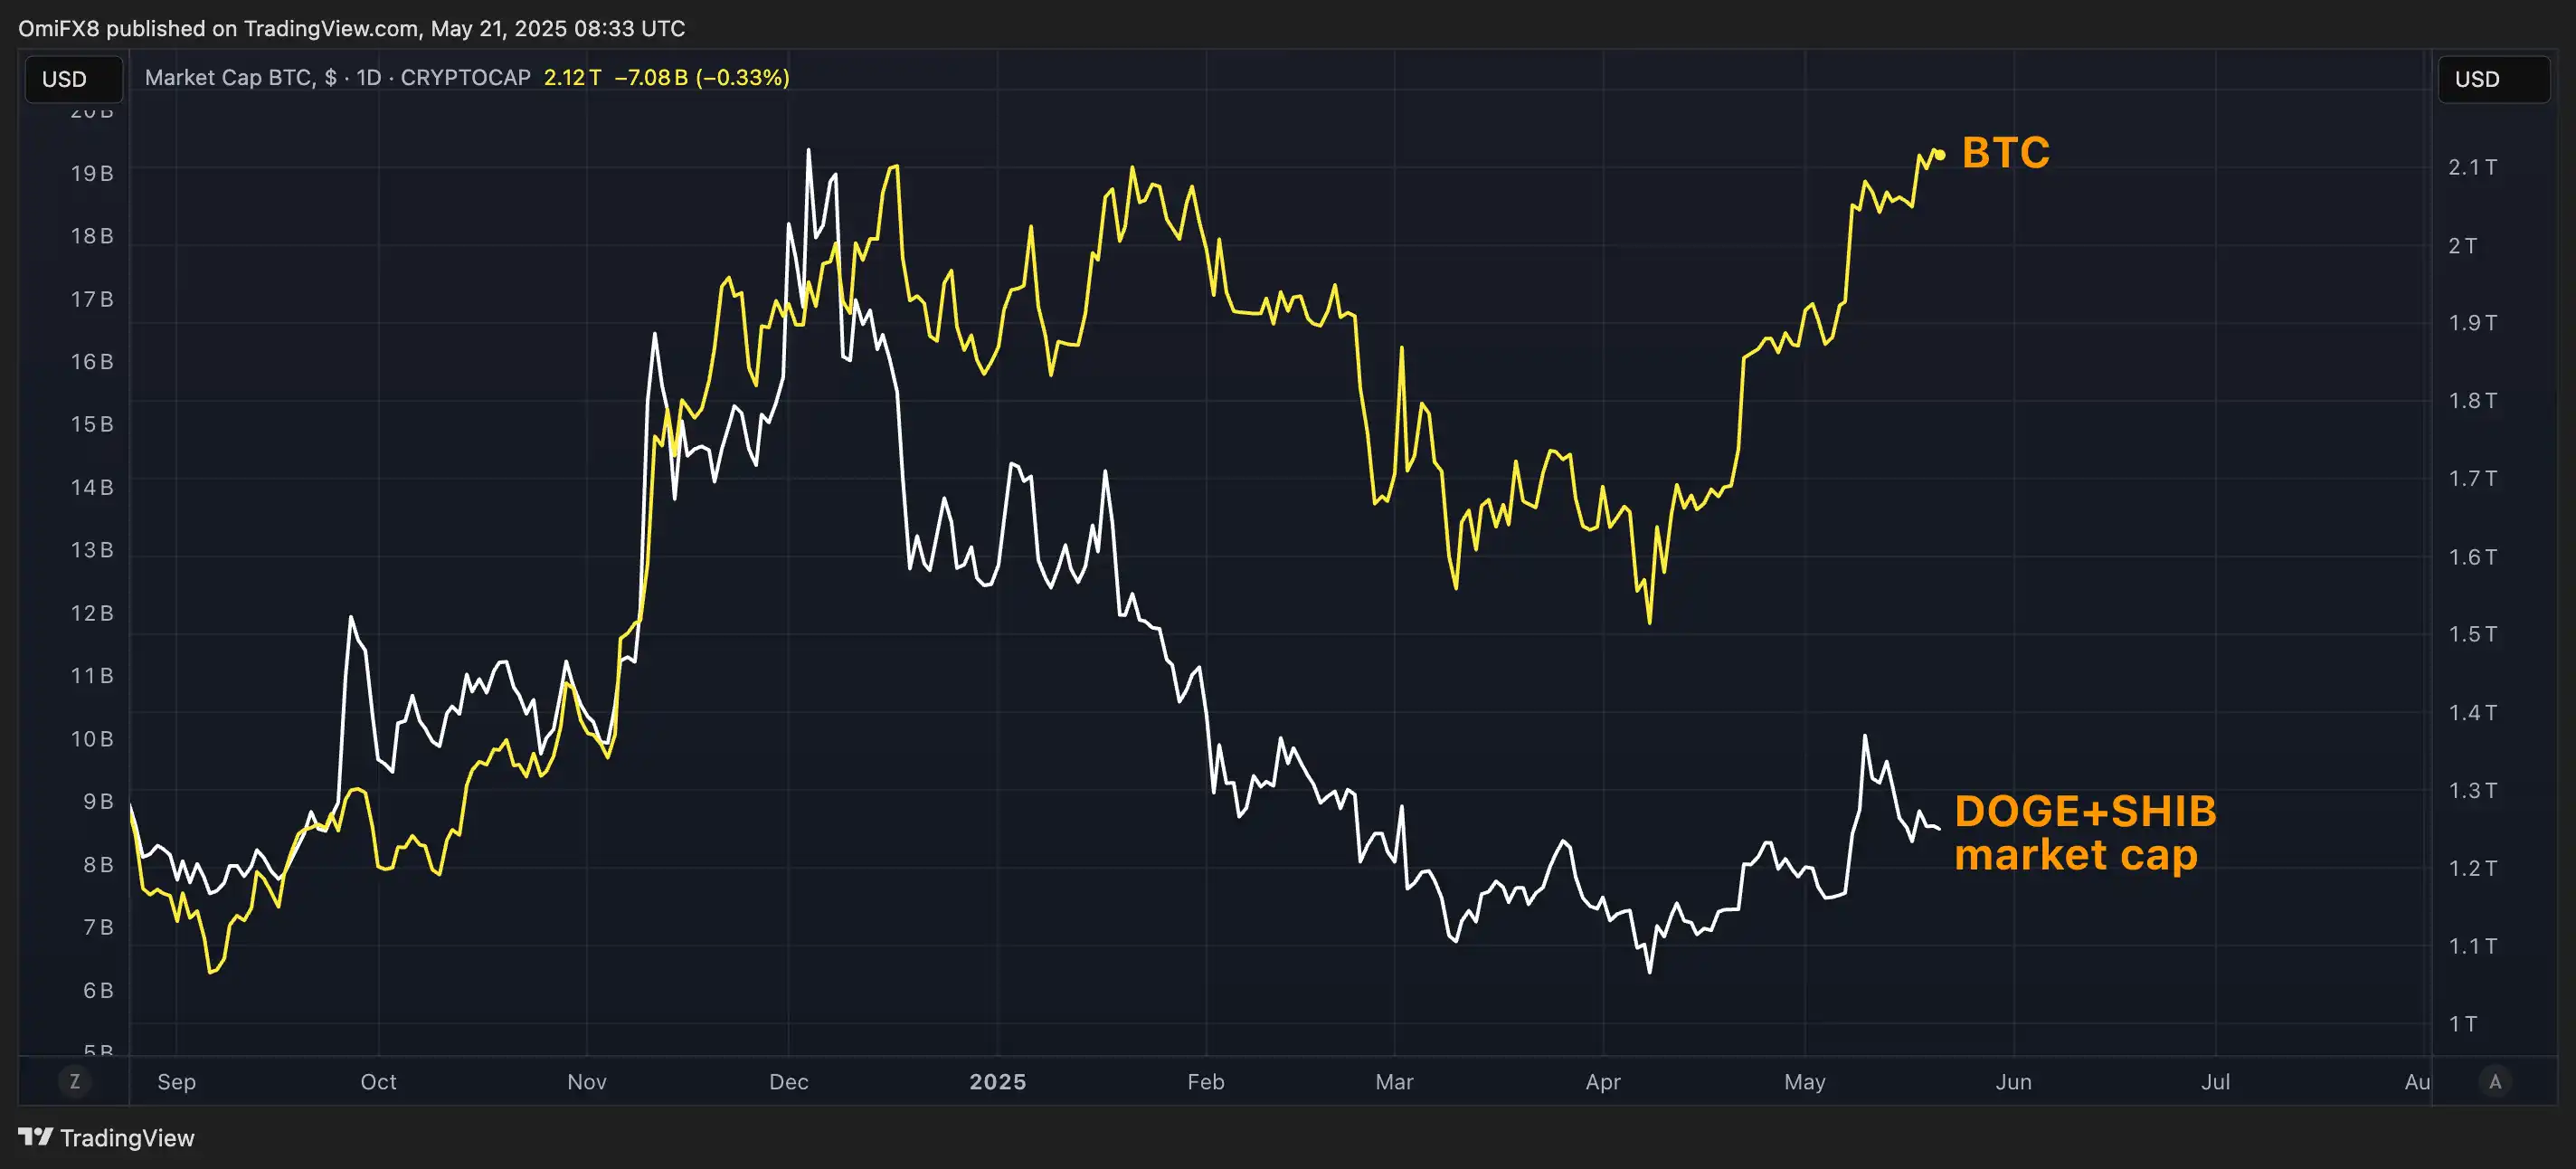
Speculative frenzy shows a lack of signs
Historically, Bitcoin's periodic or cyclical tops, including from December last year to January of this year, have often been accompanied by a high degree of speculative sentiment in the market, which tends to drive up the market cap of "non-serious" tokens like DOGE and SHIB.
But there are no signs of anything like that at the moment, and the combined market capitalisation of DOGE and SHIB is still well below the January highs.
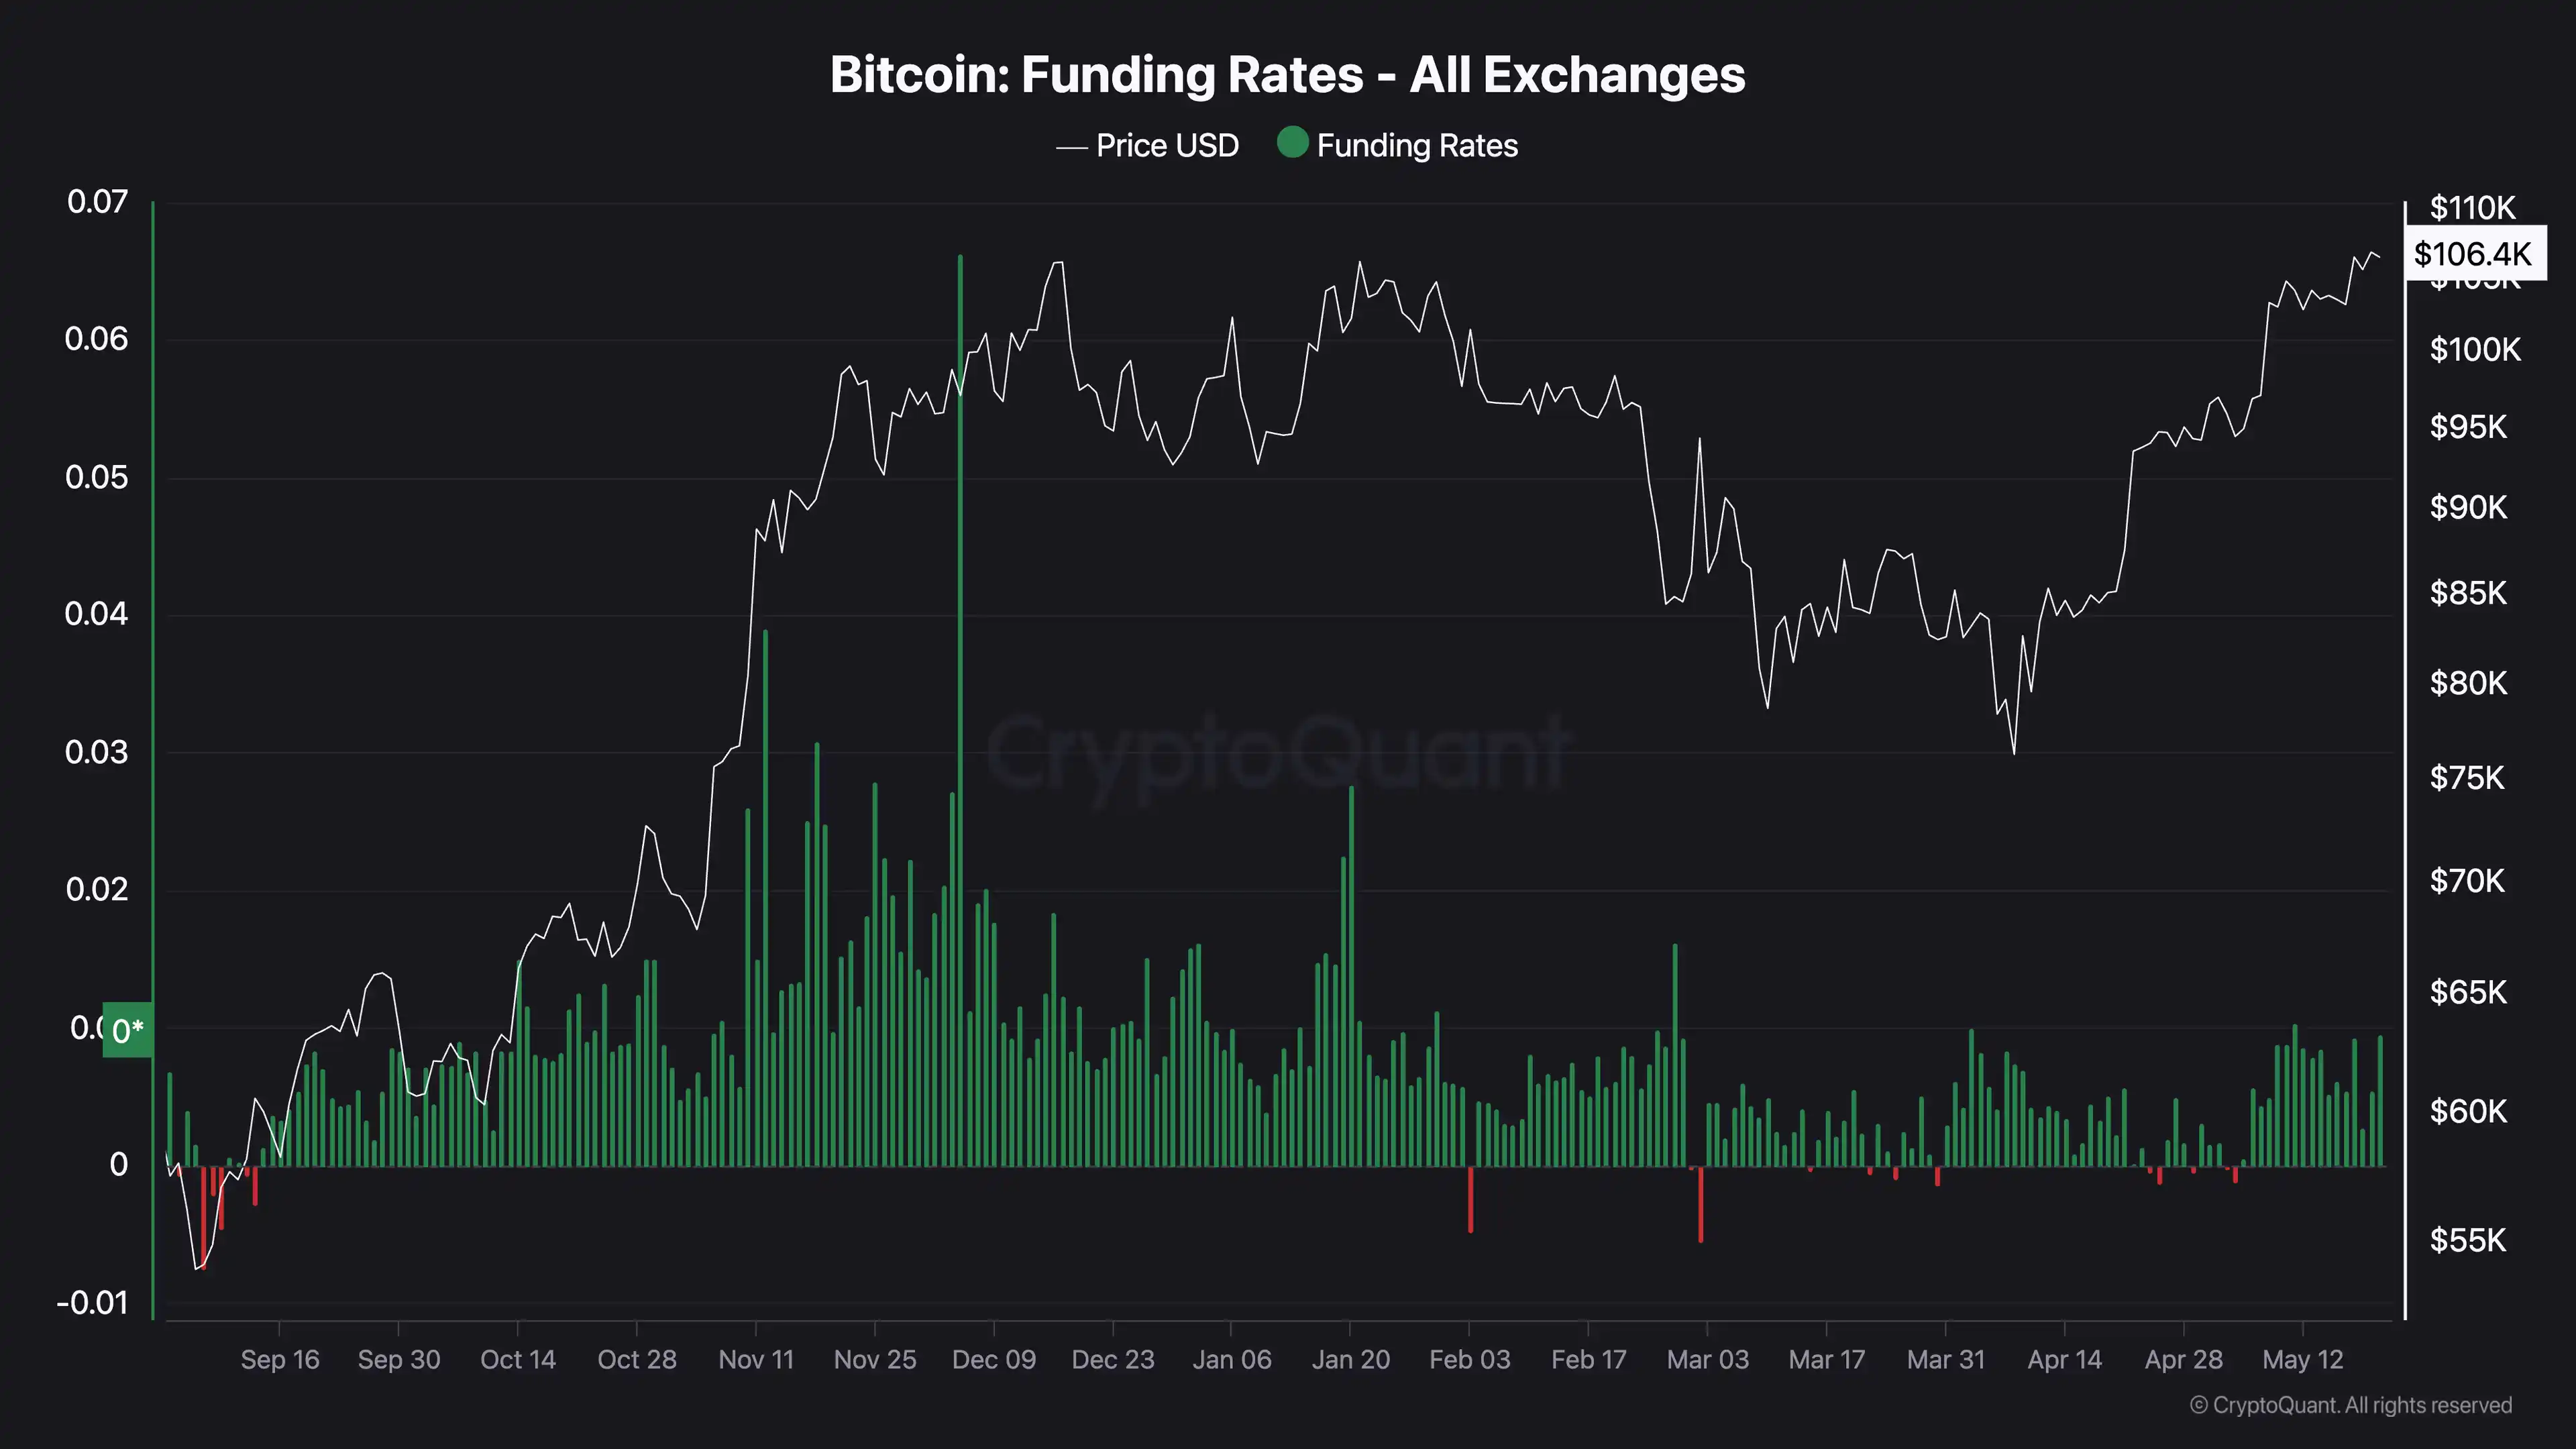
There are no signs of overheating
Although Bitcoin is currently close to its all-time high, it is reasonable that there is indeed a certain demand for long leverage in the perpetual contract market. However, the overall positioning remains light, showing no signs of over-leveraging or overheating of bulls, and the funding rate is well below the high in December last year.
The chart shows the funding rate, which is the cost of holding a perpetual contract. A positive value indicates that the bulls are willing to pay a premium for the position, i.e. the bulls pay the bears to keep the position open. This is often seen as an indicator of bullish sentiment in the market.
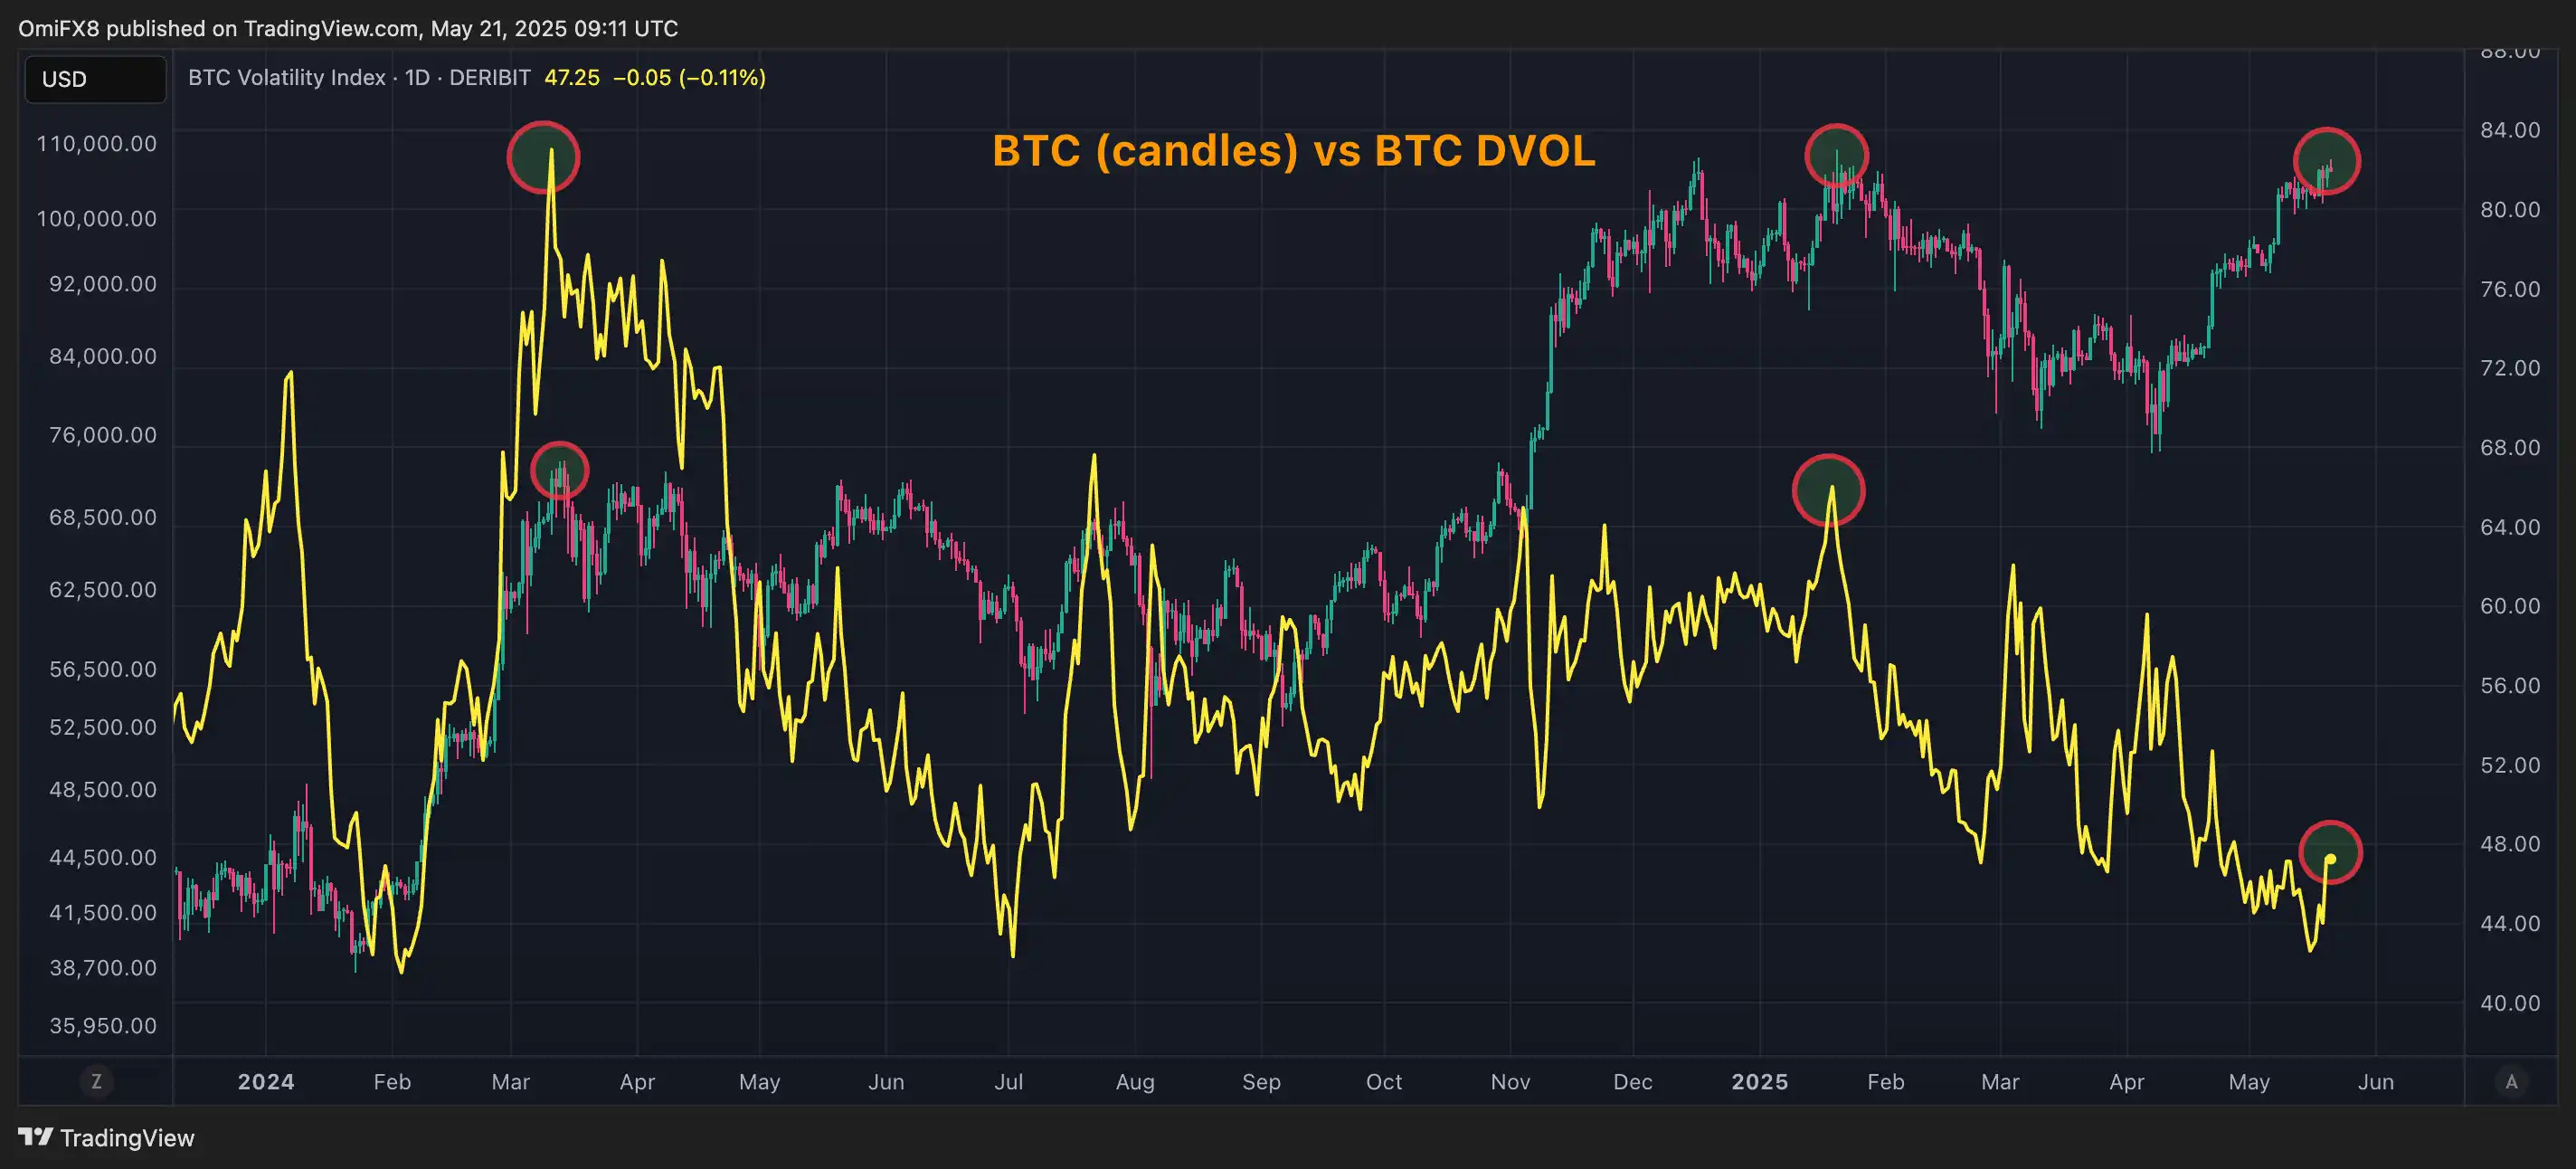
Implied volatility shows that the market is stable
Judging by the implied volatility, the current Bitcoin market appears to be calmer. Deribit's DVOL index, which reflects expected volatility over the next 30 days, is significantly lower than it was from December last year to January this year, and when the price high occurred in March 2024.
Low implied volatility means that traders are not expecting wild swings or significant uncertainties, which are often a sign of an overheated market. Therefore, it also indicates that the upward trend is more rational and may be more sustainable.
「Original link」