On-chain data week review: Bitcoin hit a new high for the third time in the current cycle, or there is still room for growth
By Glassnode
Compiler: Felix, PANews
Highlights:
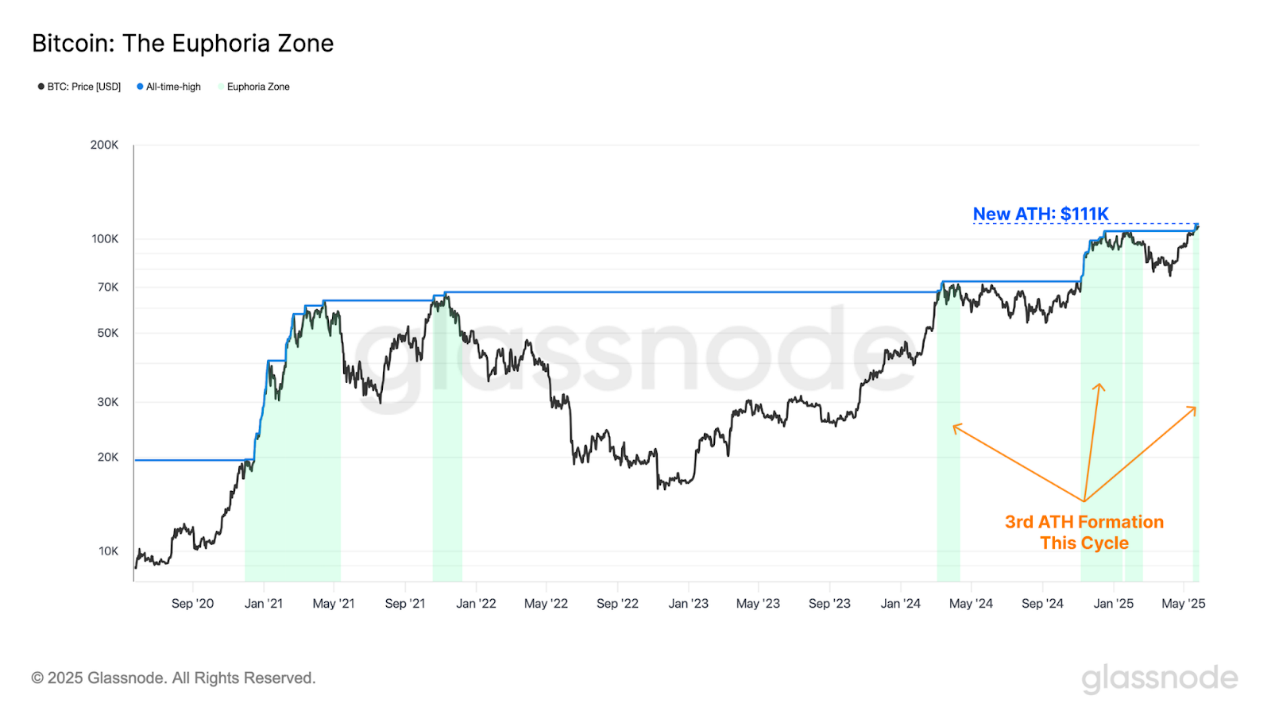
- The Bitcoin market continued to strengthen, hitting a new high of $111,000, the third new high in the cycle.
- Investors' profitability and selling behaviour have improved significantly, and are still below the previous peak of the bull market.
- Exchange-related interactions have increased dramatically, with about 33% of Bitcoin's on-chain trading volume now taking place through centralised exchanges.
- Activity in the derivatives space is also increasing, with both open interest in both the futures and options markets seeing significant growth.
- If Bitcoin rises further, $120,000 will be the key area. Based on the crossover of on-chain price models in previous cycles, it is expected that seller pressure will accelerate in and around this area.
Bitcoin breaks new highThe
Bitcoin market remains strong, reaching a new high of $111,000, which is the third time in the cycle that it has broken through a new all-time high. Historically, the price discovery phase has often been followed by a brief sell-off, as early gainers have seized the opportunity to exit at new highs and reduce risk.
Bitcoin has followed this pattern so far, falling back to $107,000 shortly after the initial breakout before recovering and consolidating around $108,000 for the rest of the week.
Against the backdrop of a challenging macroeconomic situation and heightened geopolitical tensions, Bitcoin has outperformed most asset classes, making the overall outlook uncertain. In a relatively difficult market environment, this strong performance is indeed an encouraging sign.
: GlassnodeComparingthe
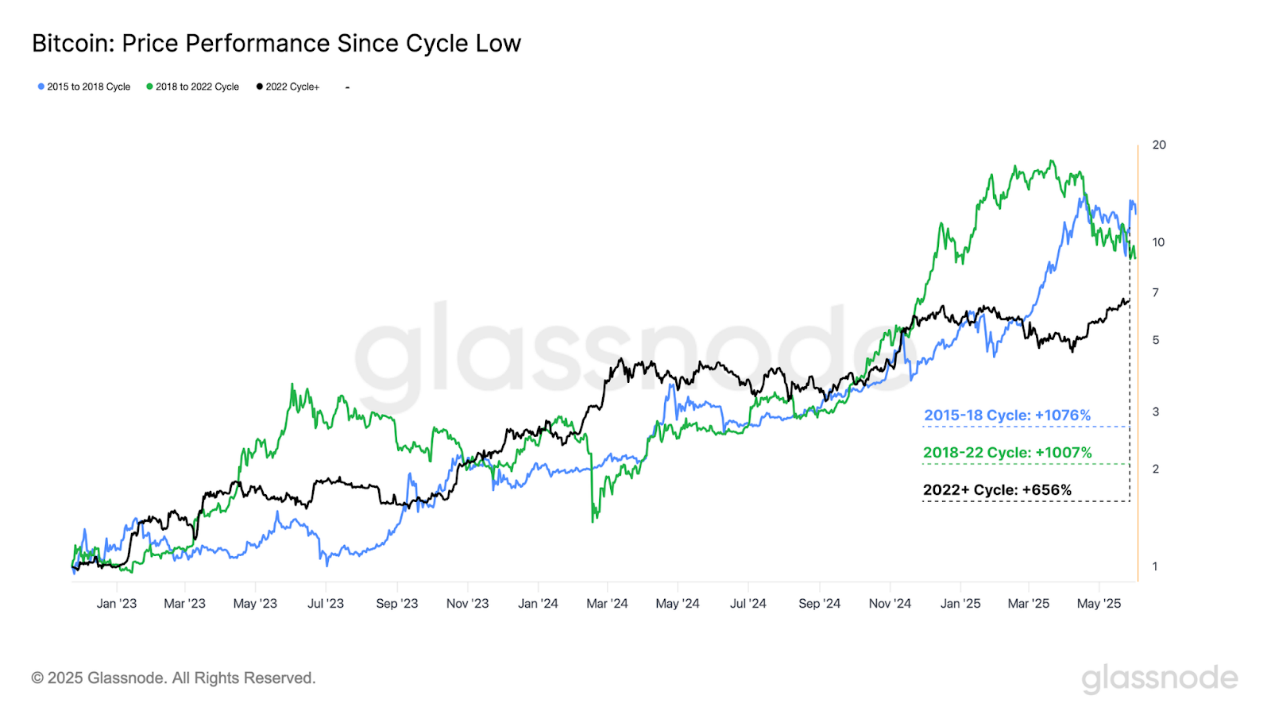
price performance of the current cycle with the previous cycle, you will find that although the total market capitalisation size of Bitcoin differs by several orders of magnitude, there is a striking similarity in structure. The chart below illustrates the performance since the relative cycle lows:
- 2015-2018 cycle: +1076%
- 2018-2022 cycle: +1007%
- 2022 and beyond: +656%
It's a remarkable achievement to still be so close to the previous cycle considering that Bitcoin has increased its market cap so much today. This shows that the scale of demand for Bitcoin keeps pace with the growth rate of the asset.
: Glassnode
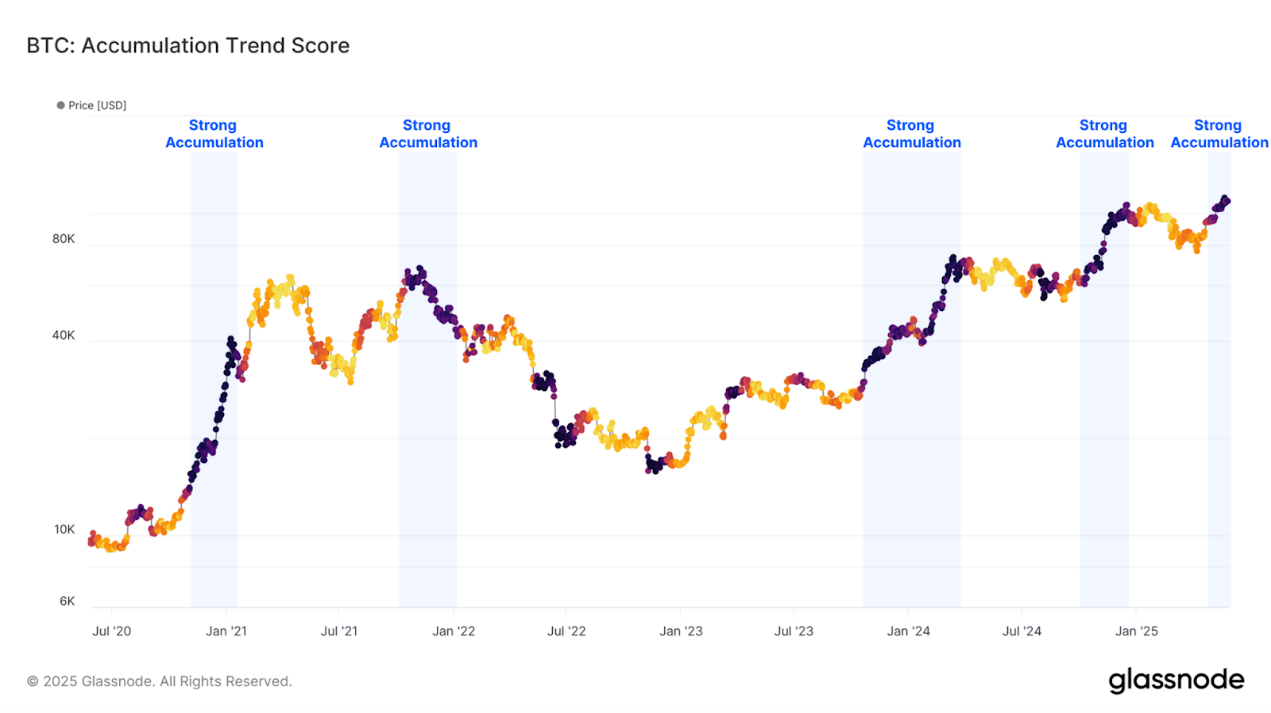
Evaluating the pattern of overweight for different wallet sizes, we can see that new highs tend to inspire significant overweight. This will push the overweight trend score towards the highest value of 1.0.
Notably, the pressure to increase holdings has increased significantly when it hit all-time highs of $70,000 and $107,000 in March and November 2024, respectively. This suggests that investors tend to buy heavily as the market enters the price discovery phase, but it also shows that existing holders tend to take profits when prices are higher. This "herd effect" highlights the convergence behaviour of market participants at key psychological levels and events, such as breaking new highs.
In contrast, the last cycle, which hit an all-time high of $69,000 in November 2021, has faced significant overweight pressure during and after the price peak. This finally marked the arrival of a cyclical top and kicked off a long bear market in 2022. While a strong overweight is usually a positive sign, it's important to recognise that overwhelming consensus behaviour isn't always a reliable indicator of future direction (it can actually be a contrarian indicator).
 – >
– >
Source: Glassnode
Profit Level Rises
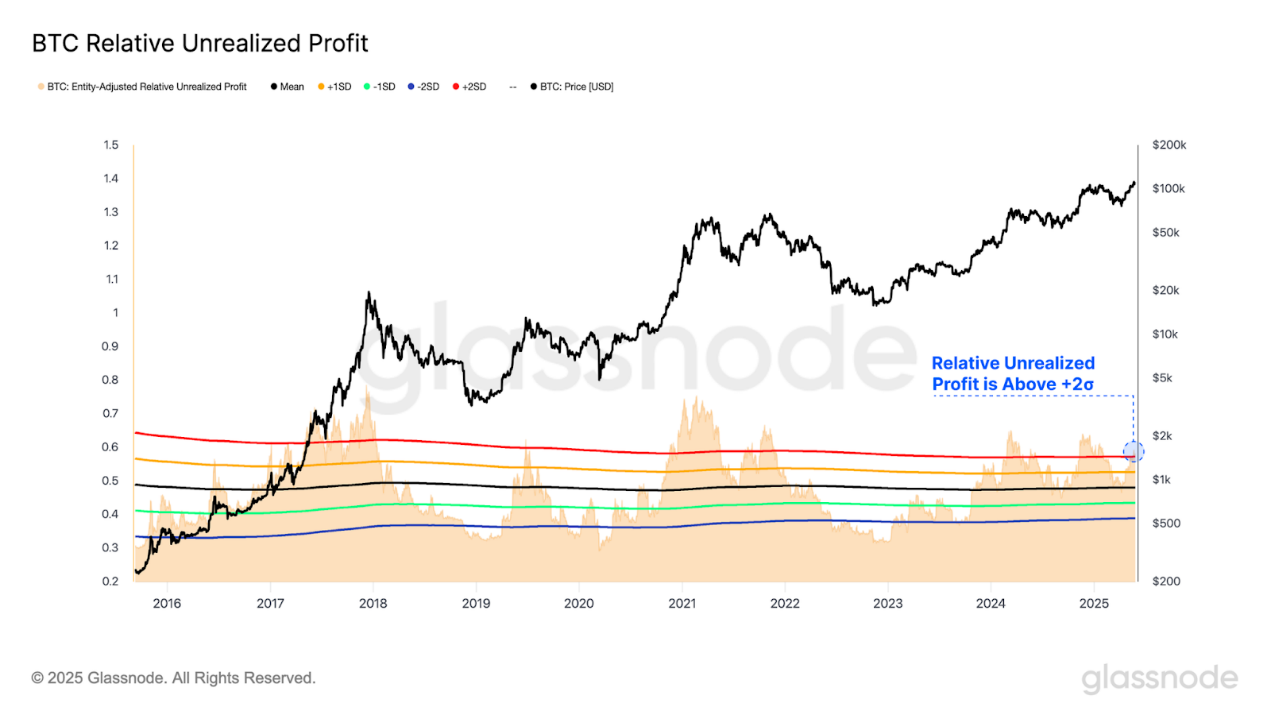
As the market re-enters the price discovery phase, unrealised profits held by market participants rise significantly. As investor profitability improves, seller pressure is often expected to increase accordingly. As the price rises, a larger number of buyers will be needed to absorb the tokens in circulation in order to maintain the upward momentum of the market.
Relative unrealised profit is an important tool to measure the size of the overall book profit of the market. Currently, the indicator has broken through the +2σ range, a level that historically usually coincides with the market entering a frenzy phase. This environment is usually accompanied by a large increase in volatility and tends to be short-lived, with only 16% of trading days exceeding this level in book profit.
: Glassnode
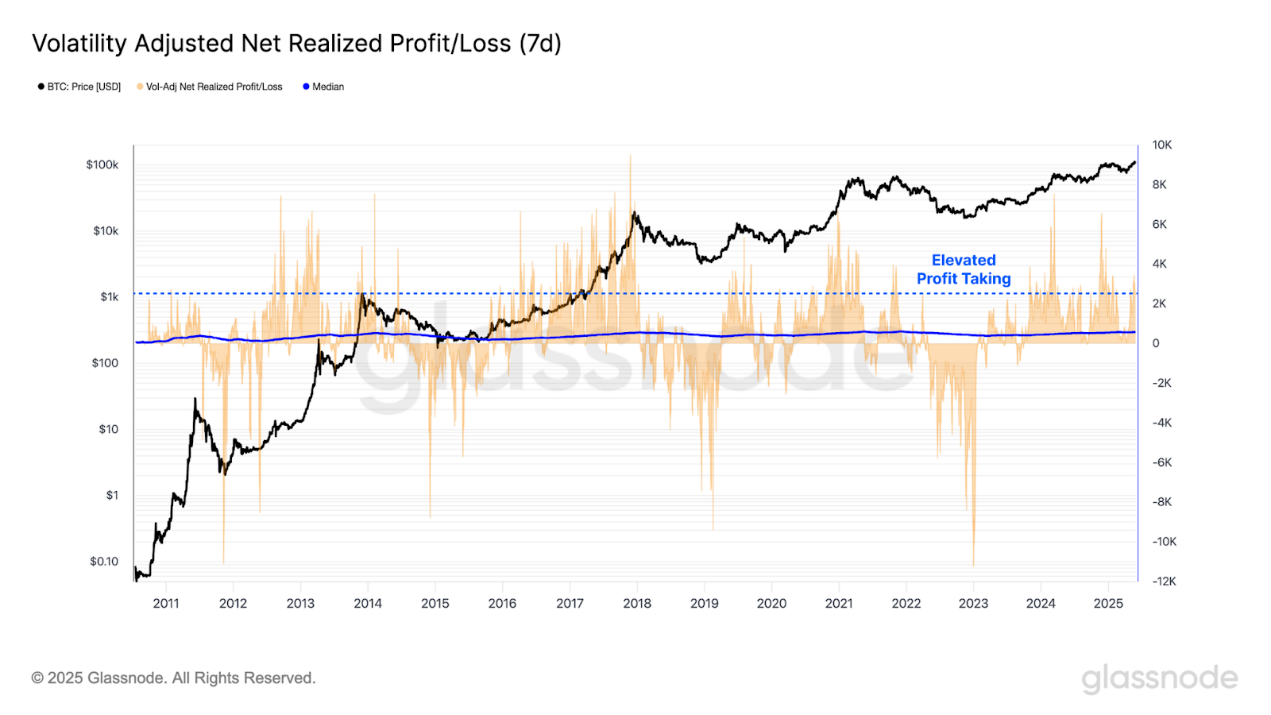
In the face of this extremely lucrative situation, there has been a noticeable increase in profit-taking activity, which can be observed through the "Volatility Adjusted Net Realized Profit/Loss" indicator.
This metric measures realised profits and losses in Bitcoin, normalised by periodically comparing them to Bitcoin's growing market capitalisation. In addition, the indicator is adjusted based on the 7-day realised volatility.
As the price broke above its previous all-time highs, profit-taking increased significantly, with only 14.4% of trading days seeing higher values. This suggests that profit-taking has increased, but it has not yet reached extreme levels.
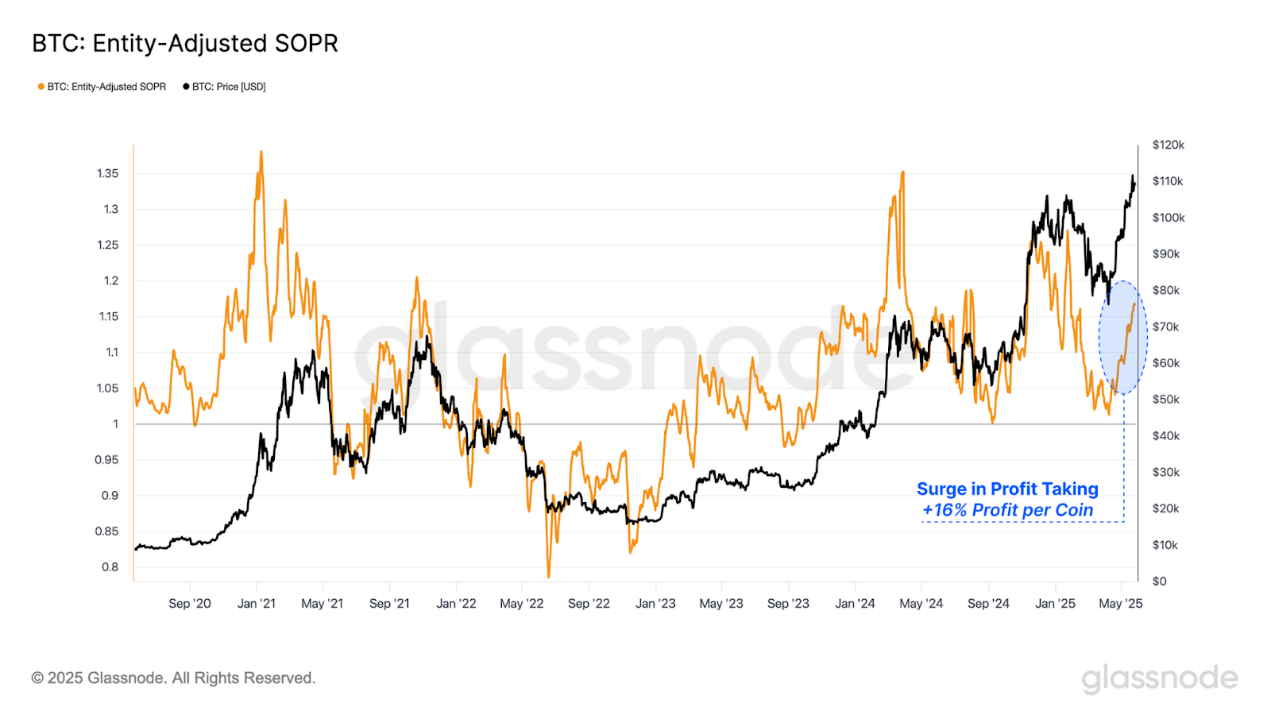
: GlassnodeThis
result is also reflected in the SOPR indicator, which reflects the degree of profit/loss of an asset and can be used to determine whether the selling price of an asset is higher than the buying price. Recent all-time highs have led to a significant increase in locked earnings, with an average profit of +16% per token. For investors, less than 8% of trading days where the level of profitability exceeds this level indicates that investors are massively shifting to profit-taking activities. However, it has not yet reached the level of extreme frenzy seen during the previous price peak.
 – >
– >
: Glassnode
Exchange Activity IncreasesCentralized
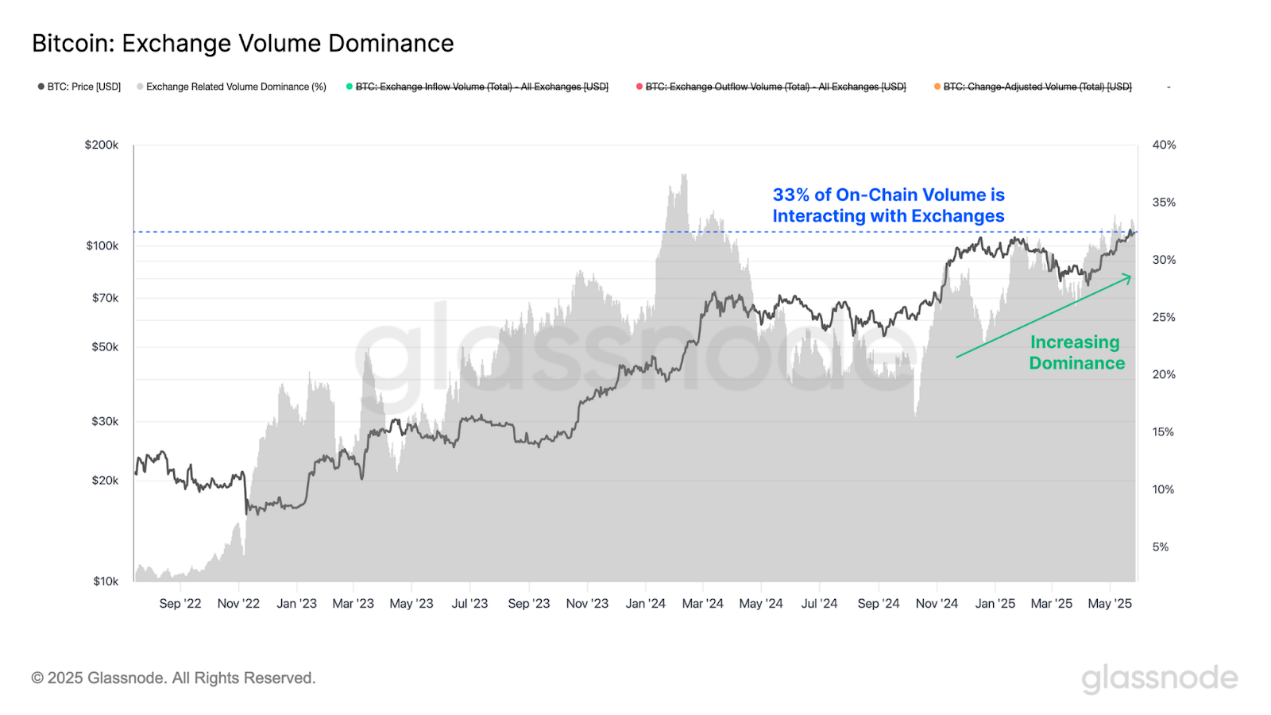
exchanges remain the main venues for trading and speculation, with daily inflows and outflows ranging from $4 billion to $8 billion. The exchange's deposits and withdrawals can be used as a measure of investors' willingness to trade Bitcoin when compared to the total volume of transactions settled on-chain.
The exchange volume dominance indicator has been on the rise since hitting an all-time high of $109,000 in early 2025, and it's continuing to climb as the market rebounds. Currently, about 33% of the trading volume on the Bitcoin network interacts with centralised exchanges.
This marks a significant increase in investor demand and trading activity, coinciding with the market entering a new phase of price discovery.
: Glassnode
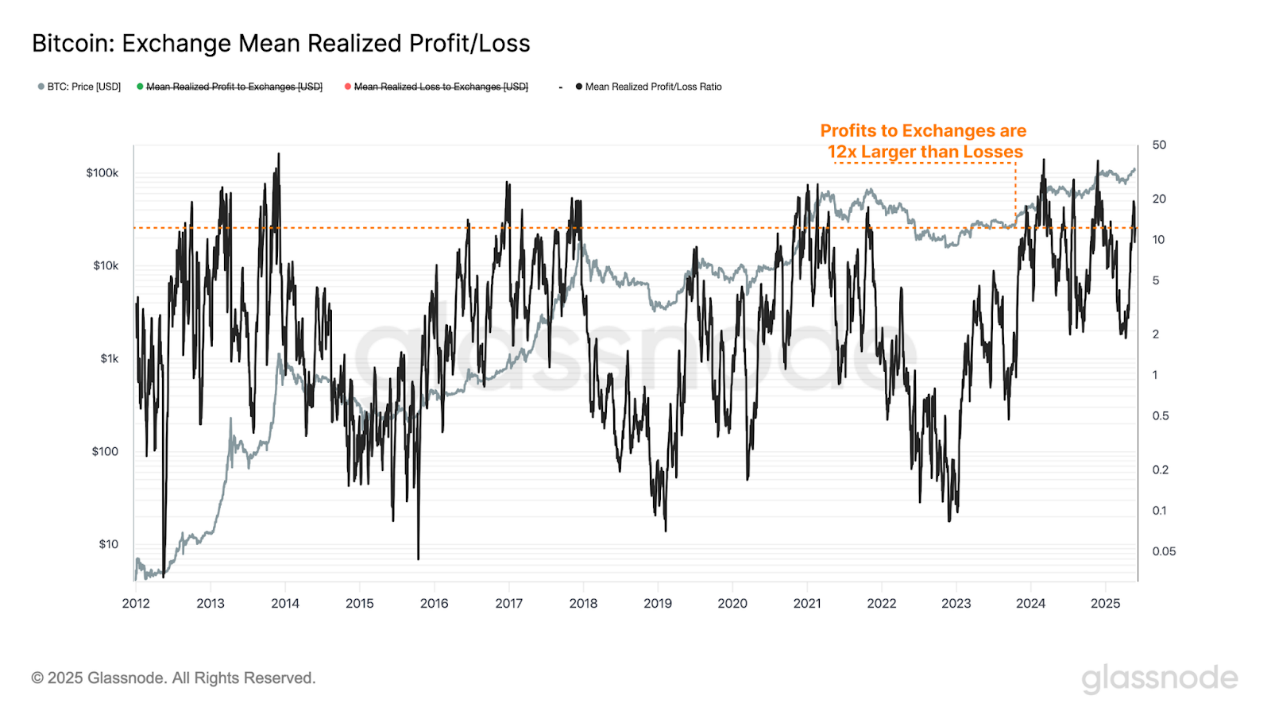
By combining on-chain token price markers with Glassnode's centralised exchange address tags, it is possible to estimate the average profit and loss of tokens deposited into the exchange. This provides a more granular insight into investor sentiment and trading behaviour that is directly related to exchange activity.
Currently, the average coin profit of tokens deposited on the exchange is about $9,300, while the average coin loss is only $780. This discrepancy suggests that current trading behaviour is predominantly profit-driven, reflecting a significant shift in investor sentiment.
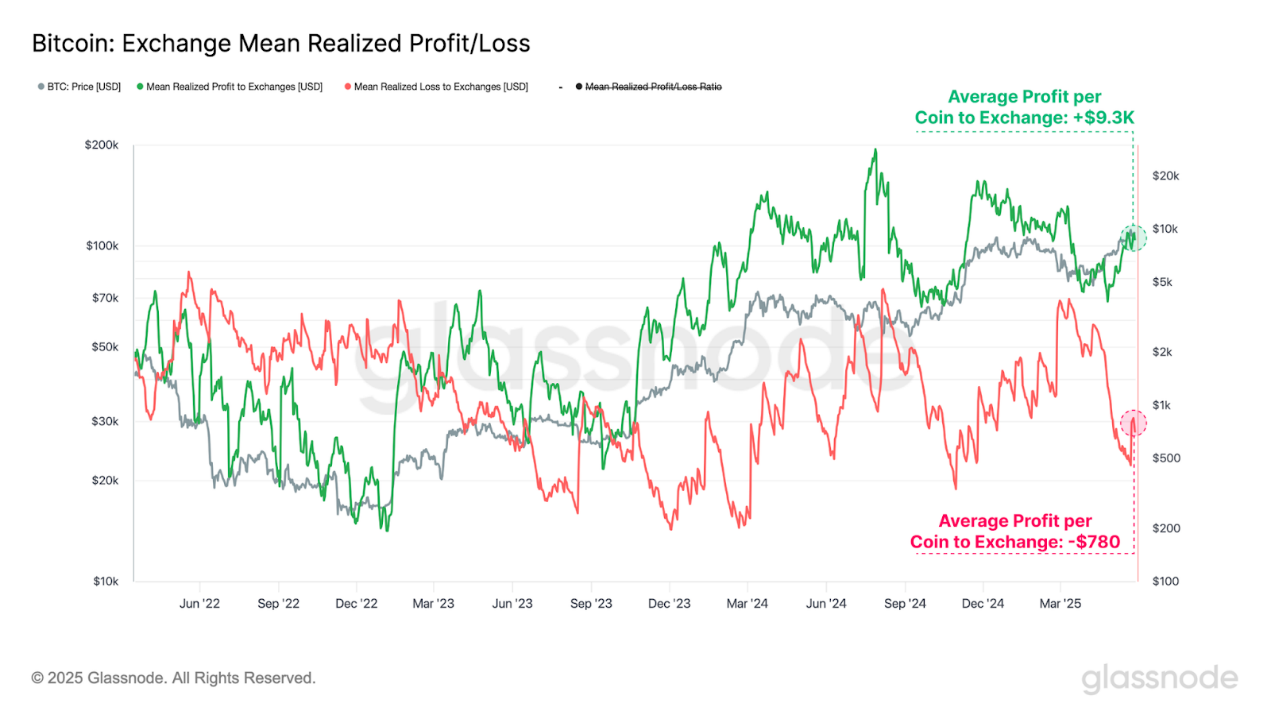
: Glassnodehas
an average profit of 12 times its loss, and the ratio between the two is close to the extremes that are common in the most active phases of bull markets in the past. The extreme level of the average P/L ratio on exchanges is a further indication that the market is entering a bull market frenzy.
 – >
– >
: Glassnode
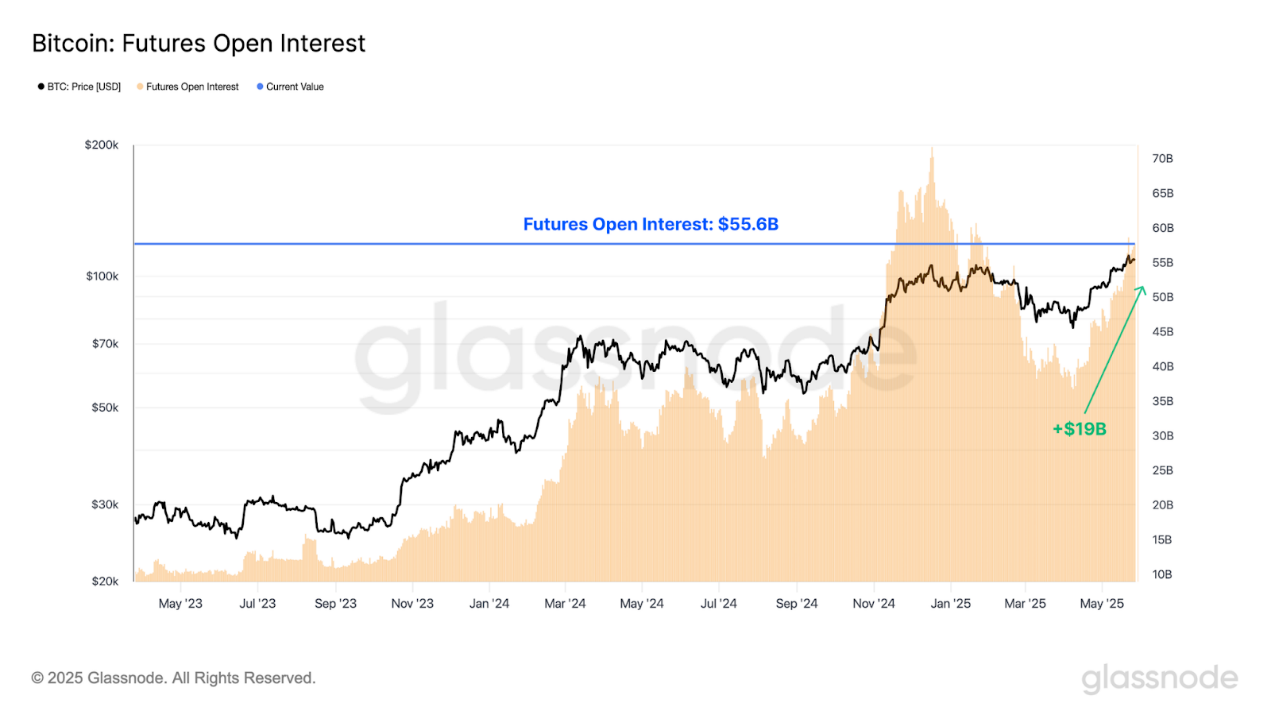
Derivatives Leverage Levels RiseAs
centralisedexchange activity increases, it is increasingly important to look at the derivatives market to help understand the level of leverage accumulated in a bull market environment.
Since hitting a local low of $74,000 in April, open interest in futures contracts has grown significantly, from $36.8 billion to $55.6 billion currently. In the last 49 days alone, $19 billion has increased (a 51% increase), indicating that leverage levels are rising.
 – >
– >
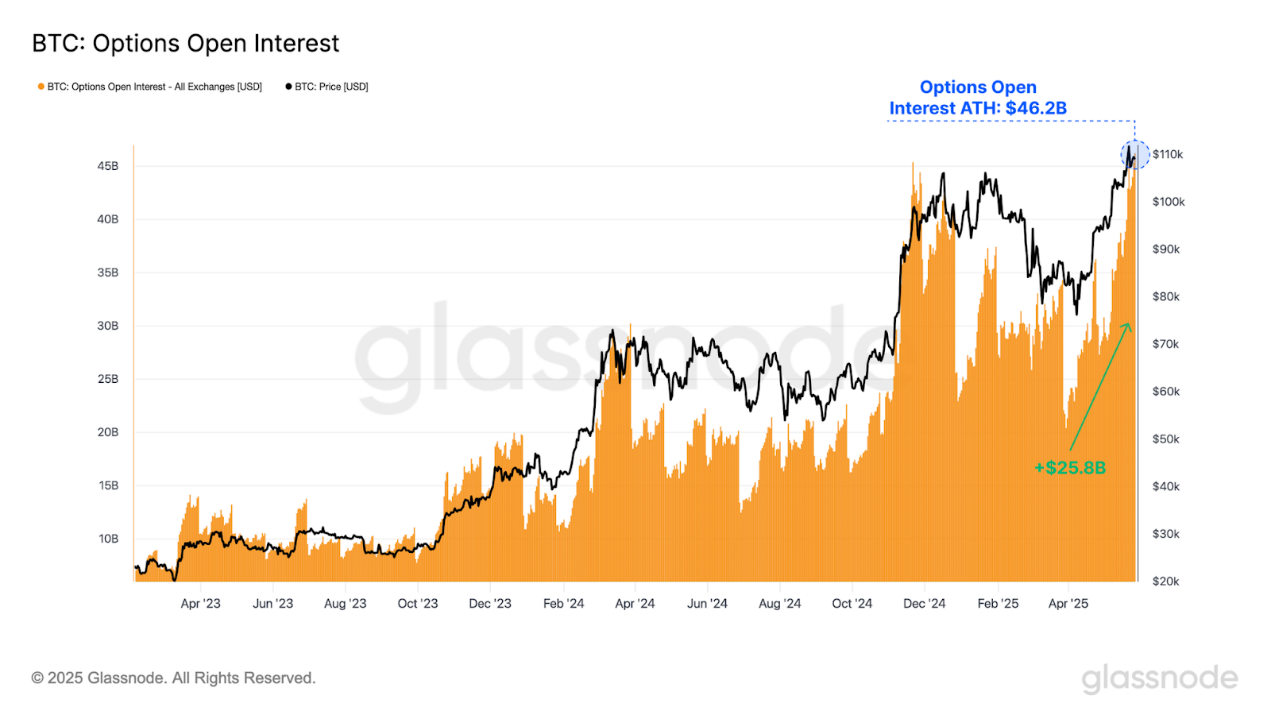
: GlassnodeMeanwhile
, open interest in options contracts surged from $20.4 billion to $46.2 billion, an all-time high. The $25.8 billion increase was significantly higher than the increase in open interest in the futures market.
The rapid increase in options open interest reflects the growing sophistication of the investor base, which is increasingly utilising options contracts to execute more complex strategies to optimise their risk management and trading positions.
 – >
– >
: Glassnode
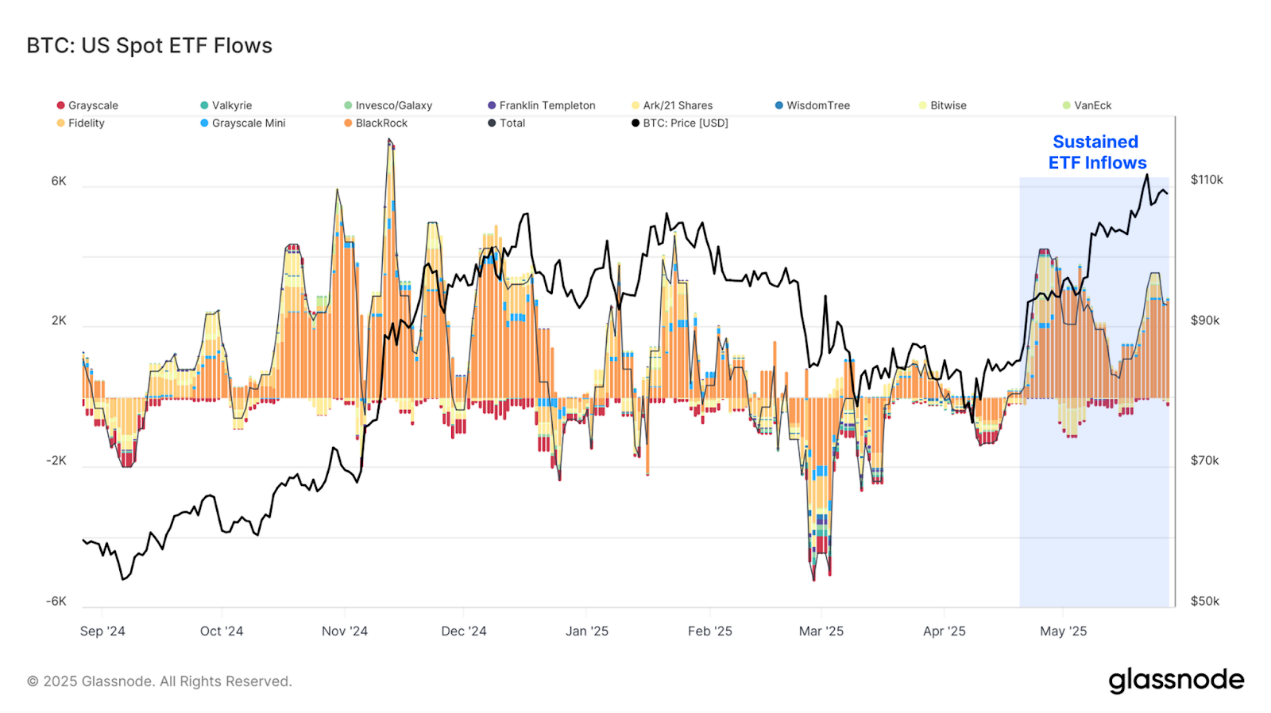
ETF Inflows remain strong
Interms of spot ETFs, buyers have been buying since late April and remain strong. Over the past week, ETFs have seen daily inflows of more than $300 million.
This massive and sustained buying from retail and institutional investors shows that they still have confidence in the asset and has been a significant driver of the market's record highs since its launch in 2024.
: Glassnode
Price Discovery ExplorationAs
the Bitcoin price returns to the price discovery phase, on-chain data and technical metrics can be combined to assess market momentum and identify potential signs of overheating.
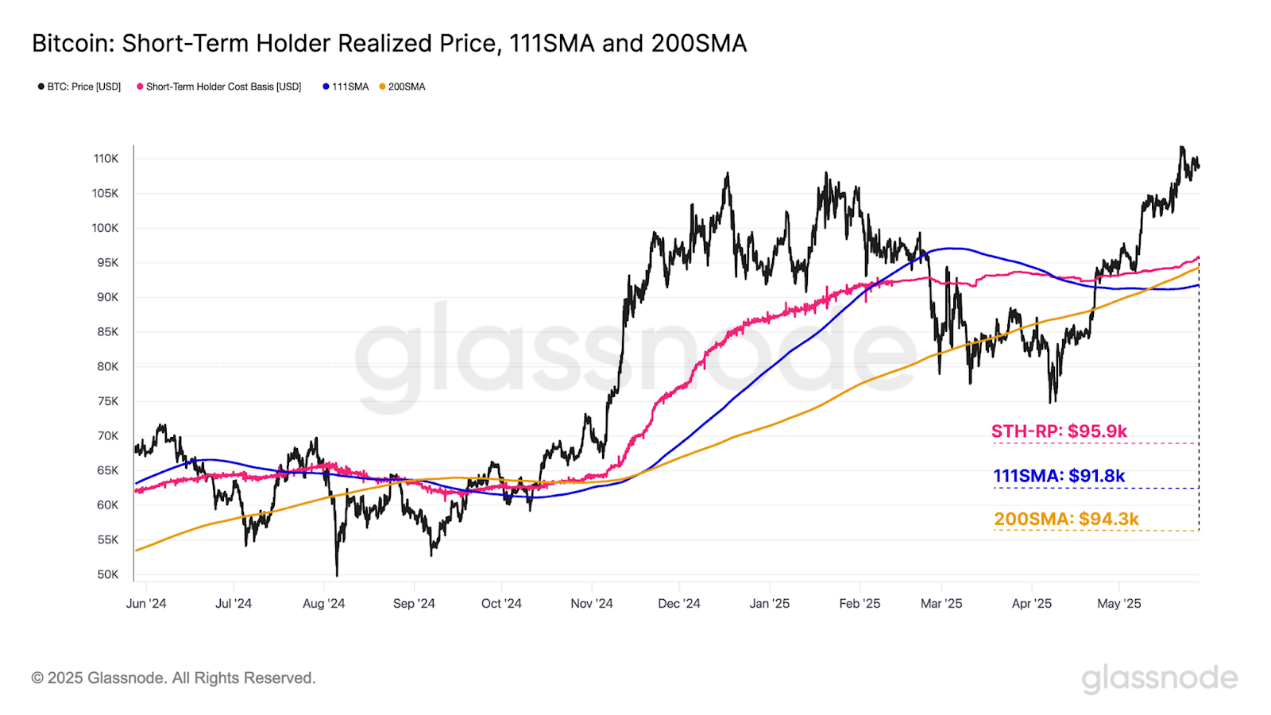
The111-day moving average (DMA) and 200-day moving average are common technical indicators to assess the momentum and trend strength of the Bitcoin market. These technical price models can also be supplemented with an on-chain metric called short-term holder cost, which reflects the average purchase price for new investors in the market. Historically, this level has been a critical threshold and is often used to distinguish between local bull and bear markets.
- 111-Day Moving Average: $91,800
- 200-Day Moving Average: $94,300
- Short-Term Holding Cost: $95,900
Bitcoin price is currently well above these three key levels, highlighting the strength of the market rally since April. It is important to note that these price levels are very close numerically, and this convergence has created a convergence in a key support area, which is crucial if further upward momentum is to be maintained.
 – >
– >
: Glassnode
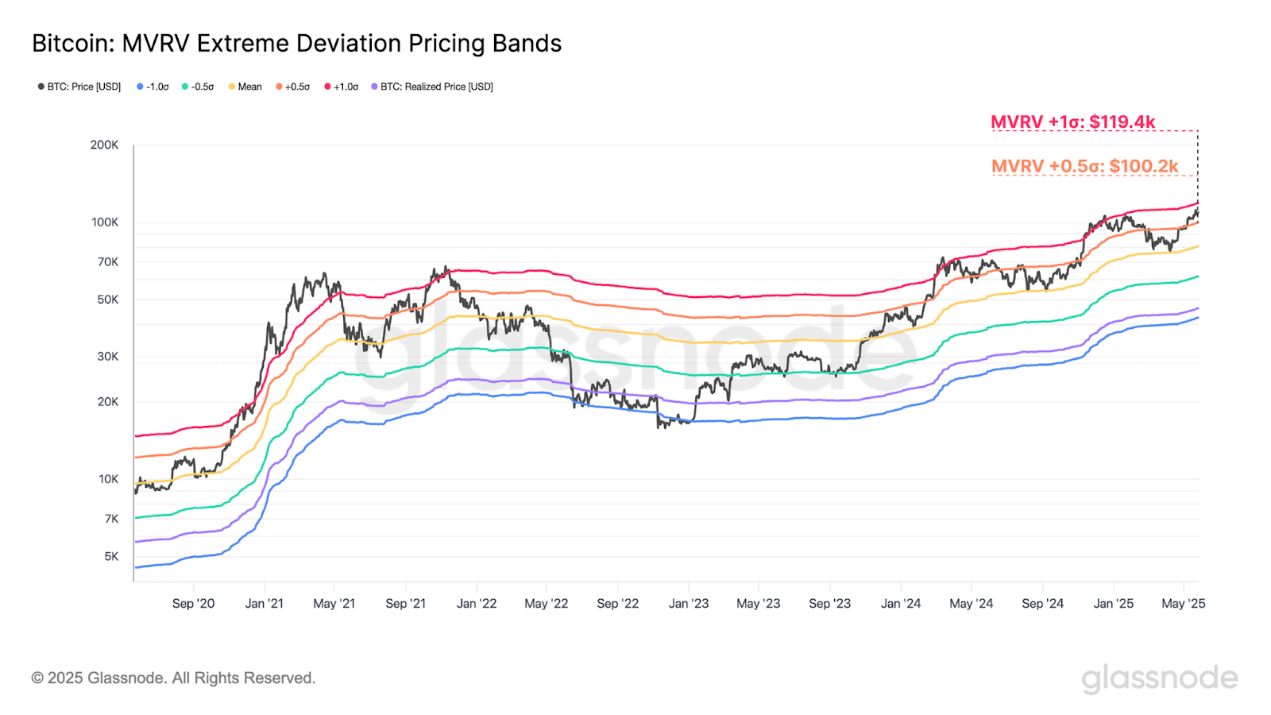
In addition, MVRV (Market Value to Realized Value Ratio) can be used to define the price range, highlighting extreme deviations from the average investor cost. Historically, breakouts of the +1σ range have tended to coincide with long-term macro top patterns.
- Realized Price +0.5σ: $100,200
- Realized Price +1σ: $119,400Currently
, the Bitcoin price fluctuates in the +1σ and +0.5σ ranges. This indicates that the market is relatively active, but there is still room for Bitcoin to rise further until investors reach extreme levels above +1σ in unrealised profits. Such extreme levels often trigger large-scale profit-taking activity, which leads to a significant increase in seller pressure.
: Glassnode
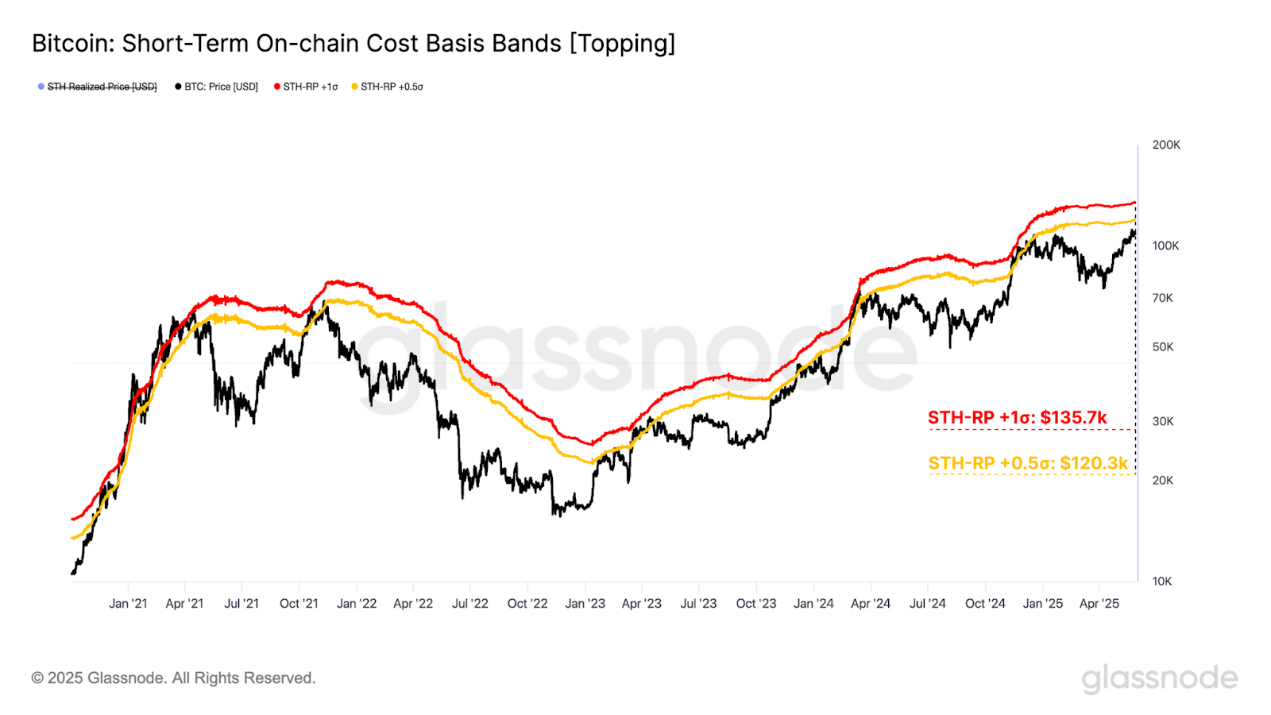
Finally, the +0.5σ and +1σ standard deviation intervals around the short-term holder cost can be used to assess local overheating.
- Short-term holder cost +0.5σ: $120,300
- Short-term holder cost +1σ: $135,700
Historically, the price has fluctuated 467 days in both of these ranges and 484 days above the +1σ level, representing only 17.5% of Bitcoin's trading history. This makes entry into the range relatively rare and often acts as the upper limit of local price action.
Although the MVRV +1σ level is often associated with a macro top, the short-term holder cost benchmark (STH-CB) +0.5σ and +1σ intervals are more indicative of the formation of a local top. Together, these models can provide a reliable framework for identifying market overheating.
: Glassnode
SummaryBitcoin
has reached a new all-time high of $111,000, the third new high in the cycle. This milestone sparked widespread activity across major sectors of the market, represented by increased investor earnings and profit-taking, increased exchange interaction, significant growth in open interest in futures and options, and continued growth in buyer demand for spot ETFs.
As the market enters the price discovery phase, the $120,000 level appears to be a key area, and seller pressure is expected to accelerate in and around this area.
Related reading: Interpretation of the six indicators: What will be the price of Bitcoin by the end of the year?