Interpretation of six indicators: What will be the price of bitcoin by the end of this year?
Written by ElonMoney Research
, Felix, PANews
Metrics such as MVRV Z-Score, Energy Value Oscillator, Bitcoin Heater, etc., are used in this analysis, as well as historical data. While historical data is a useful reference, in the current environment, its accuracy may be reduced as there are no players like Strategy, Metaplanet, and ETFs in the 2021 cycle.
MVRV Z-Score
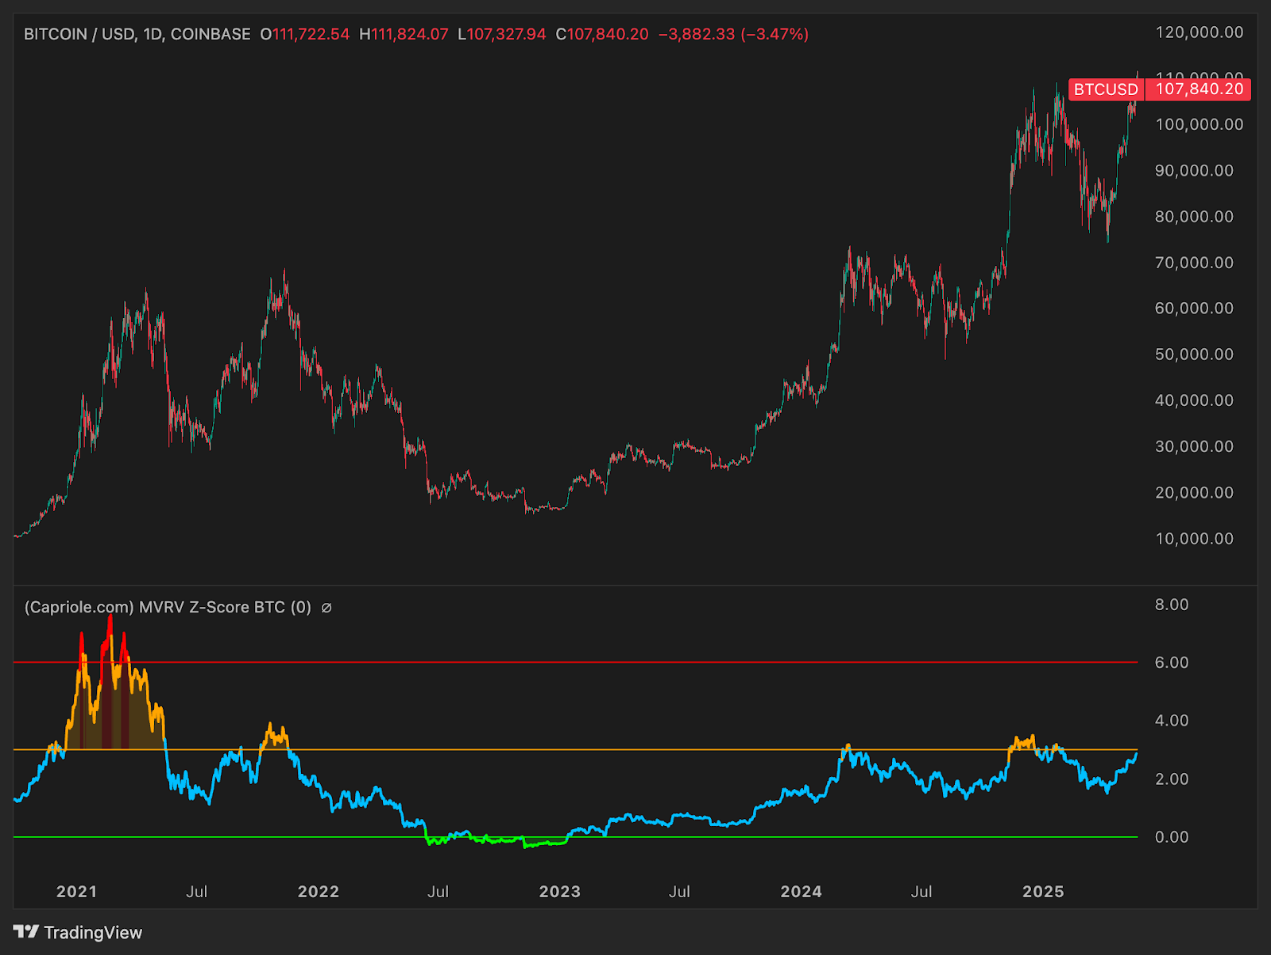
MVRV Z-Score is a measure of market valuation that looks for cyclical tops and bottoms of the market by comparing the degree to which an asset deviates from its fair value when it is undervalued or overvalued. The chart shows that the current MVRV Z-Score is around 2 to 3, in the neutral zone, away from the overheated values that occurred at the top of the market. Historically, peaks in the Bitcoin cycle have pushed this metric into the red zone (around 7 to 9), indicating a significant disconnect between market capitalization and realized market capitalization. Today, the indicator is just above 2 and is in the blue/yellow zone, indicating that Bitcoin is not overvalued.
For background: at the beginning of 2021, the metric surpassed 7 before Bitcoin reached about $60,000 to $65,000. During the bear market in 2022, the indicator dropped below 0 (green zone), indicating that the market was oversold.
From a technical point of view, there is still a lot of upside at current levels until the end of this cycle. Even if Bitcoin reaches about $100,000 to $110,000, Bitcoin is not "expensive" by MVRV standards. If Bitcoin repeats the structural pattern of previous tops, the MVRV Z-Score metric is expected to rise to 5 to 7 or higher.
This means that there will be significant upside in the market going forward. Fundamental inference suggests that MVRV-based tops tend to occur when BTC is trading well above $100,000 – possibly above $200,000, depending on the change in realized market capitalization in the coming months.
Energy Value Oscillator
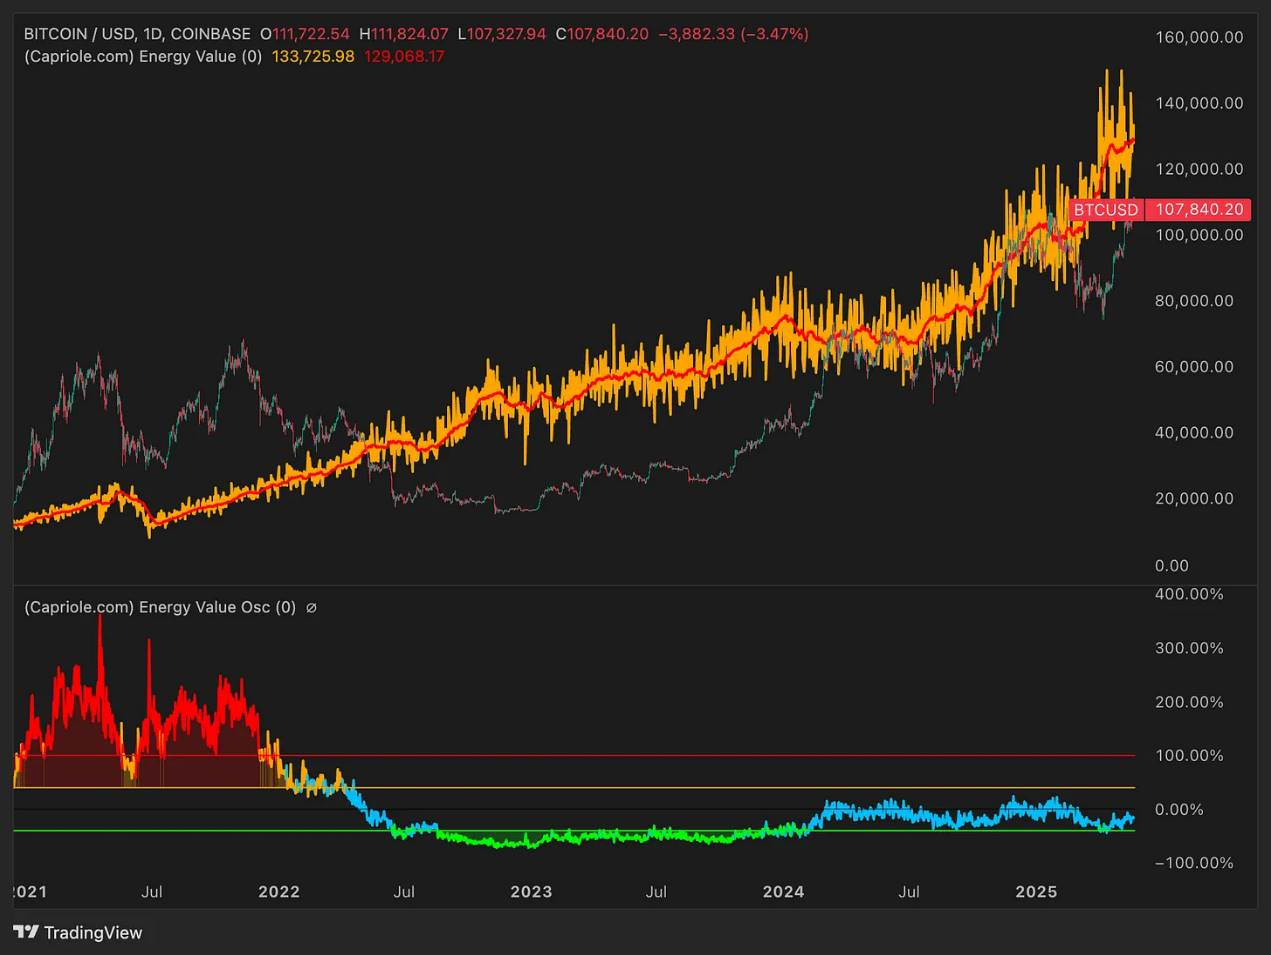
This metric measures the "fair value" of Bitcoin (energy value = hash rate × energy efficiency) based on total energy. The red-orange line in the chart above shows the energy-based fair value – approximately $130,000 as of mid-2025. The blue oscillator below tracks how far the current price deviates from the benchmark.
Historically, oscillators have moved into the red zone (valuation above 100%) when Bitcoin is trading well above its energy value. At the beginning of 2021, the price of Bitcoin was around $60,000, when its price was more than 100% higher than the value of energy. Conversely, in 2022, Bitcoin is trading below its energy value, and the oscillator is in the green (undervalued) zone.
Currently, the oscillator is trading near zero, and Bitcoin ($107,000 to $110,000) is trading 10% to 20% below the fair value calculated by the model. This shows that Bitcoin is not overheating. If the value of energy reaches about $150,000 by the second half of 2025 and prices trade at a 50% to 100% premium, which is more common near the peak of the cycle, then this would mean a price range of between $225,000 and $300,000.
In other words: the Energy Value Oscillator indicator confirms that Bitcoin still has plenty of room to rise. Until the oscillator breaks above +100%, it is unlikely that the market will be "extremely overvalued" by this standard.
Bitcoin Heater (Derivatives Overheating Indicator)
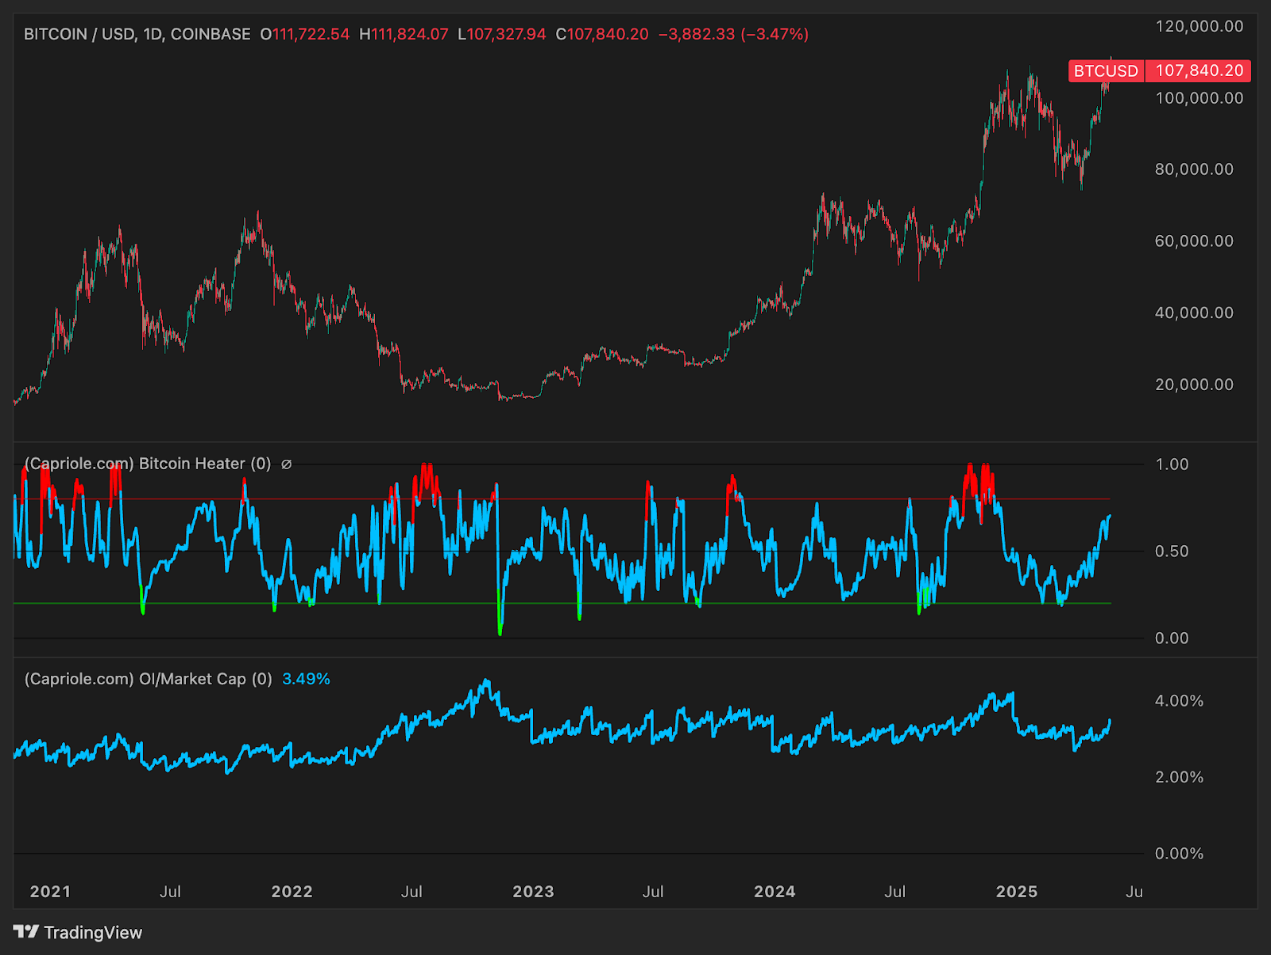
Bitcoin Heater Indicator integrates derivatives sentiment (funding rate, basis, option skew) into a single index between 0 and 1. The indicator's proximity to 1.0 indicates bubbles, aggressive long positions, and high leverage. The indicator is around 0.0 to 0.3 indicating a cooling or risk-off sentiment in the market.
In previous cycles, especially in 2021, the indicator often broke above 0.8 before a local correction. But during a strong bull market (Q4 2020 to Q1 2021), the indicator remained high, but did not trigger an immediate reversal. As of mid-2025, the indicator is around 0.6 to 0.7, which is in a warm state but has not yet overheated.
This indicates that we have not yet entered the frenzy of the cycle. In the final ascending phase, the indicator may reach 0.8 to 1.0. Until then, there is still room for the market to rise. It is reasonable for the indicator to periodically exceed 0.8 before peaking, but the eventual peak is likely to coincide with the ongoing red zone indicator.
Macro Index Oscillator
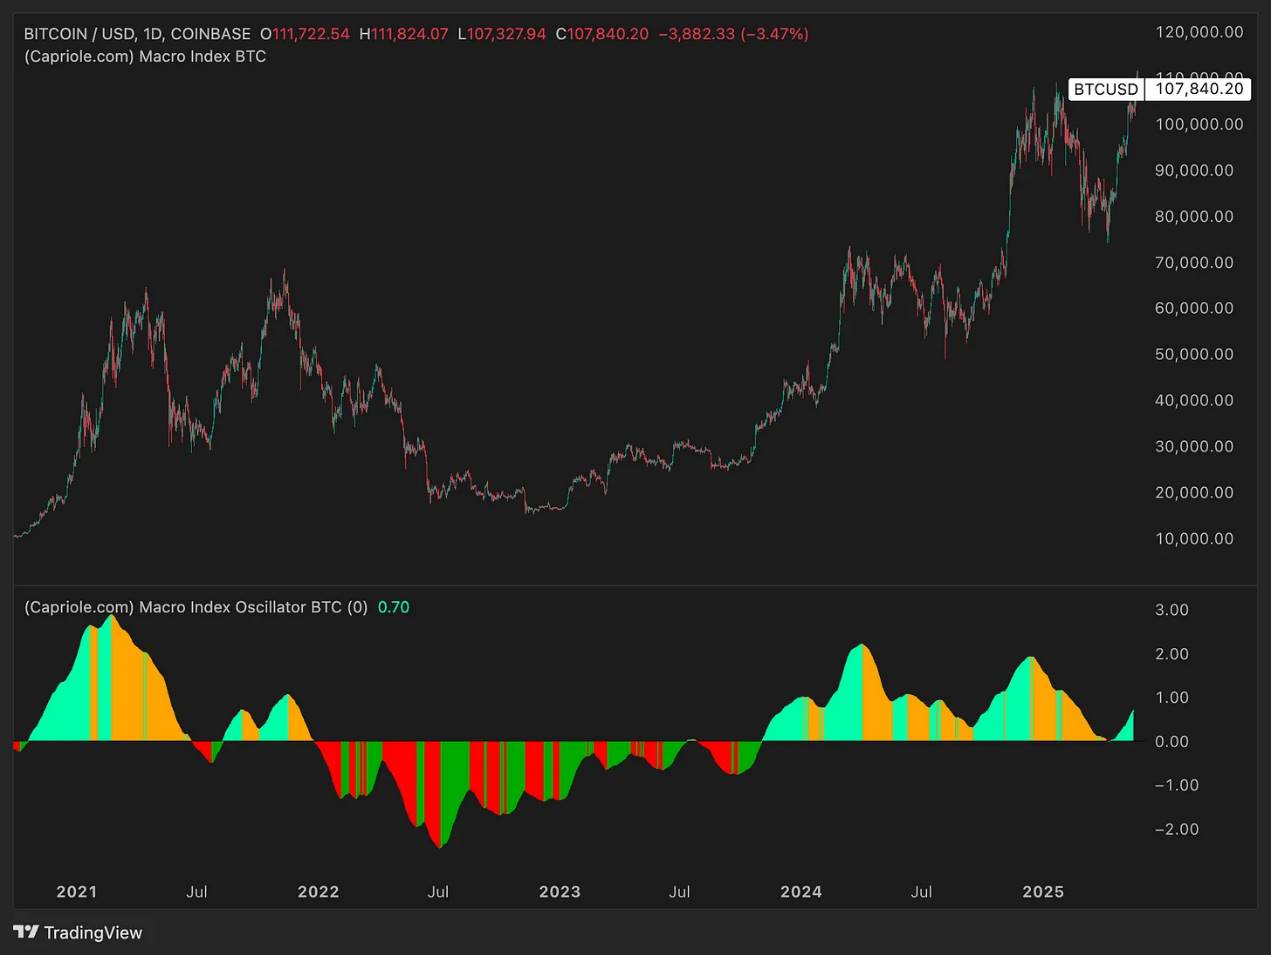
This composite index uses more than 40 fundamental, on-chain, and market indicators to assess Bitcoin's macro phase. A reading above 0 indicates expansion; An index below 0 indicates contraction or recovery.
In previous bull cycles, the indicator transitioned from negative to strong positive territory – approaching a peak of 2 to 3 in 2021. At the time of bottoming out in 2022, the indicator fell below -1. As of now, the macro index is around +0.7 – clearly in the growth phase, but still well below the extreme levels of frenzy.
This means that the cycle may be in the middle of an expansion. The indicator is expected to climb above 2.0 as the cycle progresses through the end of 2025. Until there is a stagnation or reversal in core network activity, Bitcoin still has room to rise. There are no signs of fatigue yet.
Volume Summer (Liquidity/Participation)
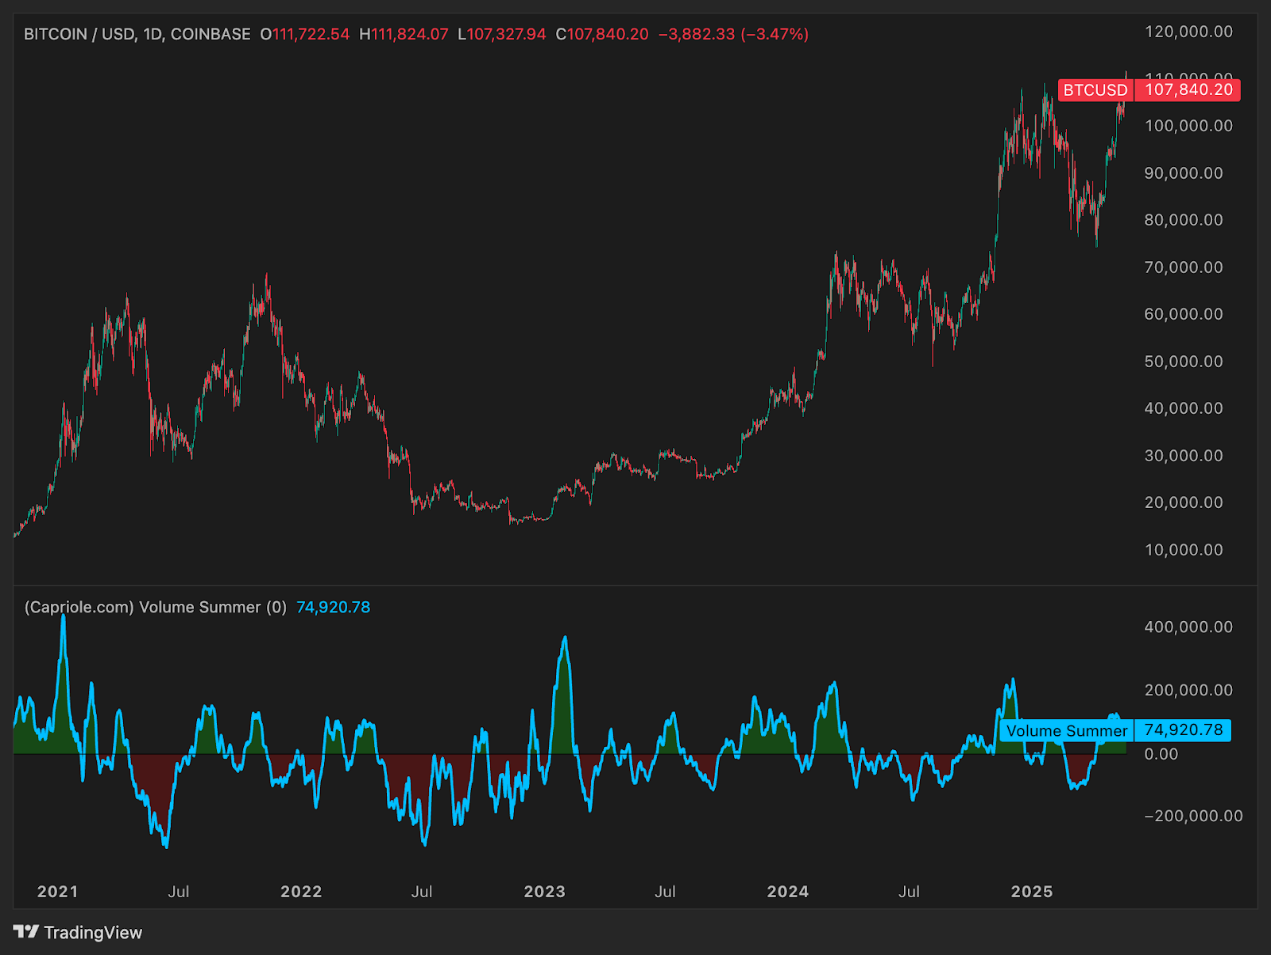
Summer aggregates the net buyer volume in the spot and derivatives markets. A reading above zero indicates a net inflow; Below zero indicates a net outflow or a decrease in trading activity.
At the beginning of 2021, the indicator soared into bright green territory – a sign of retail FOMO and fanatical engagement. In 2022, the indicator fell sharply into the red zone, confirming the massive withdrawal of funds.
At the moment the Volume Summer indicator is moderately positive (about +75,000) - bullish, but far from frenzy. This means that money is returning, but the peak liquidity phase may still lie ahead (Q4 2025?). )。 If the indicator spikes again into the dark green zone, a sharp rise is expected.
At current levels, liquidity is supportive – but far from peaking. There is still more momentum to drive further gains.
Open Interest / Market Cap Ratio (OI/Mcap):
This metric measures the leverage relative to market capitalization. In 2021, the indicator hovered between 2% and 3%. In 2023, the indicator soared to about 4%, setting the stage for a correction in mid-2024. After the market crash, the indicator was reset to 2%, clearing excess leverage.
By mid-2025, the indicator had risen back to about 3.5%. This indicates that leverage has risen again. While it is good for the market to rise in the short term (providing more impetus to the rally), it also increases the risk. If the indicator rises above 4% - 5% by the end of the year, it could signal a crowded and volatile market, prone to a wave of selling.
The final phase of this cycle is likely to be characterized by record leverage – the indicator sets new highs when the price peaks. However, there is still room for upside.
Thelikely direction of BTC in December this year
combines all indicators, and BTC is expected to be at the core of the bull cycle, but it is not yet nearing the end.
There are no extreme signals of overvaluation at the moment. Most indicators show strong growth, but they are still below the levels of historical cycle tops.
So the base case is that BTC will reach between $210,000 and $230,000 by the end of 2025, which is more than double the current level.
Based on these valuations, it is expected that:
-
MVRV Z-Score > 7
-
Energy Value Oscillator > +100%
-
Bitcoin Heater is around 1.0
-
Volume Summer is in the excitement zone
-
OI/Mcap is at historical extremes
, and only then will it be possible for this market to transition from the expansion phase to the distribution phase.