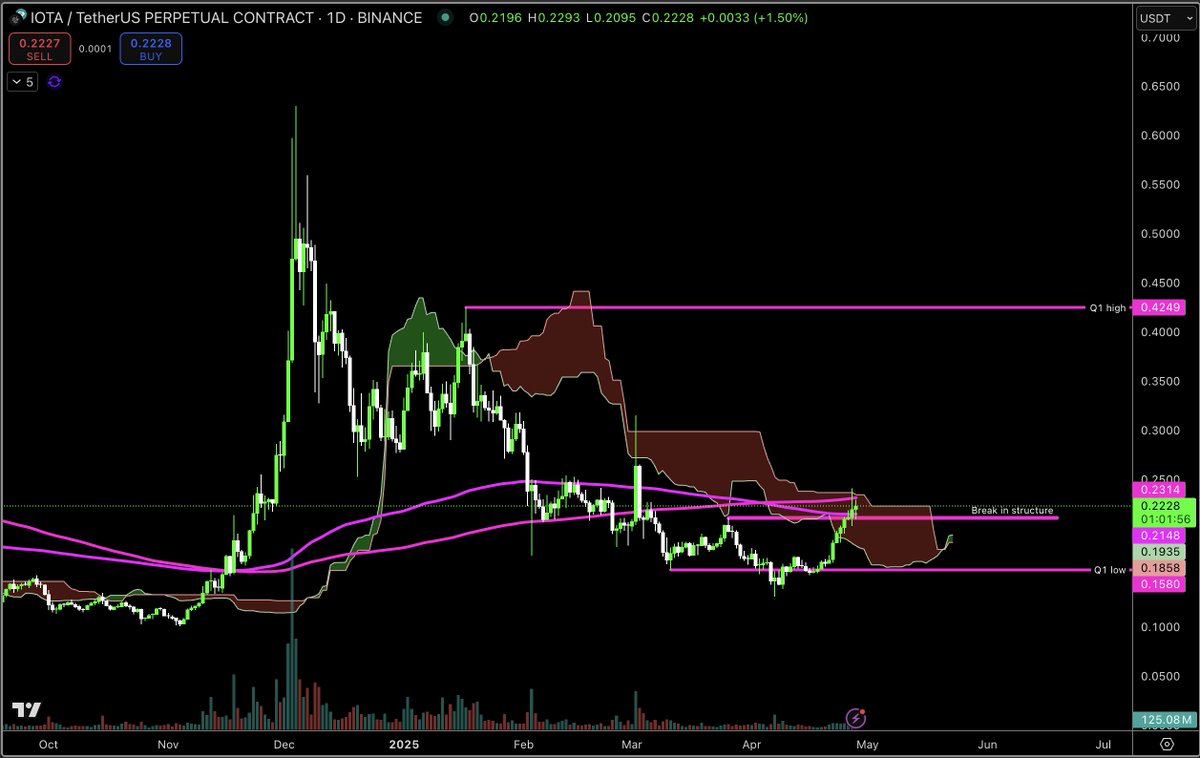
$IOTA previous high broken, 1D market structure now flipped to bulllish
200EMA reclaimed, 200MA / top of cloud acting as resistance
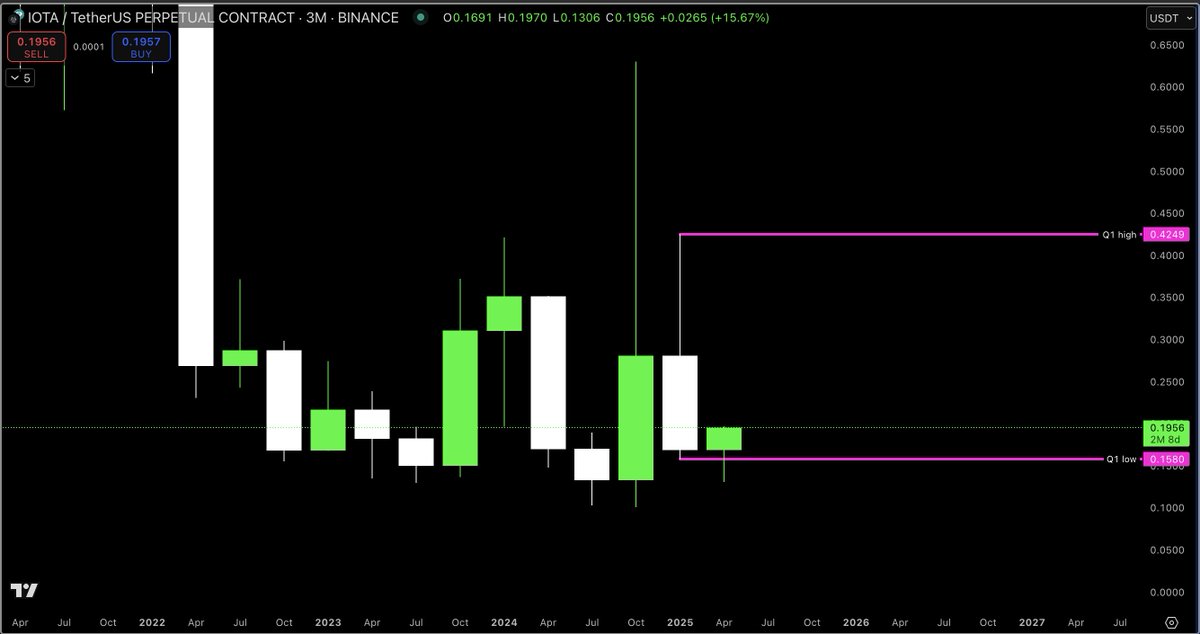
Going to add to my bag on the next dip if we get one. I like this chart a lot tbh. Monthly looks great and failed inside bar breakdown on quarterly means Q1 high should act as a magnet later on in the year if/when we see some real risk on action for alts

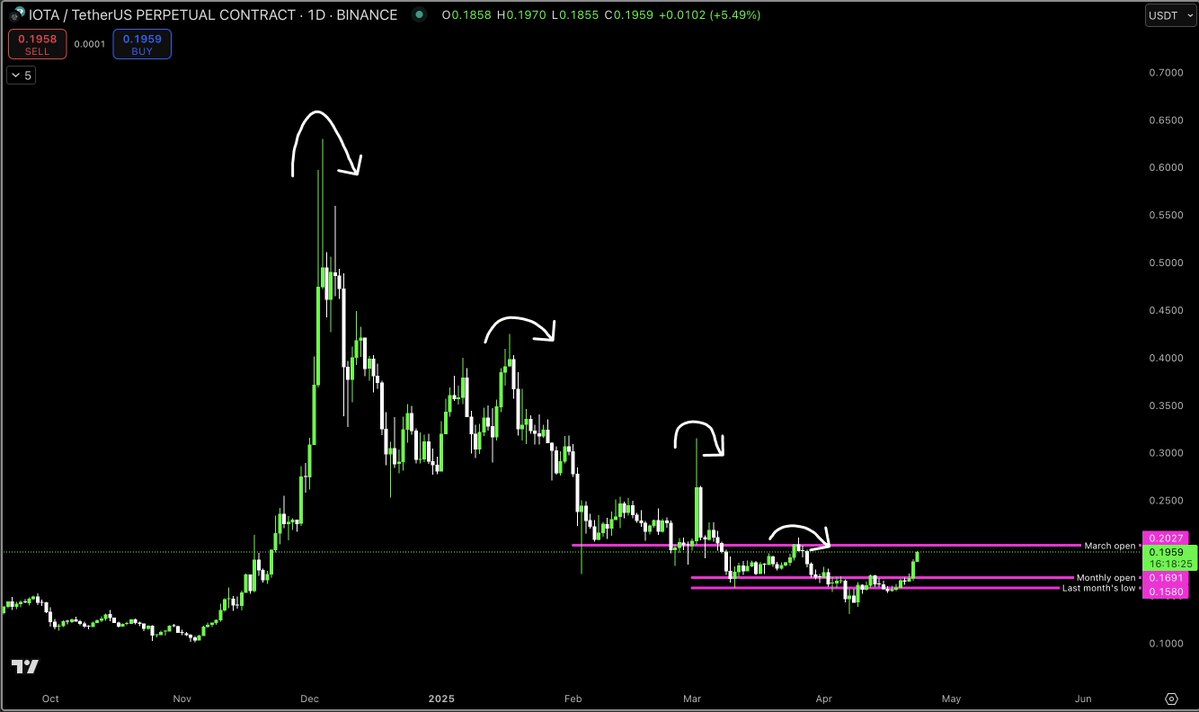
Still holding $IOTA, chart looking constructive for a bottom rn after breaking back above monthly open
March open next key level - firm smash above and daily trend will flip from bearish to bullish
Also, looking at quarterly chart, Q1 candle was an inside bar of Q4 2024. We just had a fake out of the Q1 lows, meaning an inside bar false break out. These can be powerful signals on HTF, targeting the other extreme (in this case, Q1 highs)
Still work to be done but all in all looking constructive: march open bull/bear line, bulls need to force a break above for confirmation of bottom


19.77K
309
The content on this page is provided by third parties. Unless otherwise stated, OKX is not the author of the cited article(s) and does not claim any copyright in the materials. The content is provided for informational purposes only and does not represent the views of OKX. It is not intended to be an endorsement of any kind and should not be considered investment advice or a solicitation to buy or sell digital assets. To the extent generative AI is utilized to provide summaries or other information, such AI generated content may be inaccurate or inconsistent. Please read the linked article for more details and information. OKX is not responsible for content hosted on third party sites. Digital asset holdings, including stablecoins and NFTs, involve a high degree of risk and can fluctuate greatly. You should carefully consider whether trading or holding digital assets is suitable for you in light of your financial condition.

