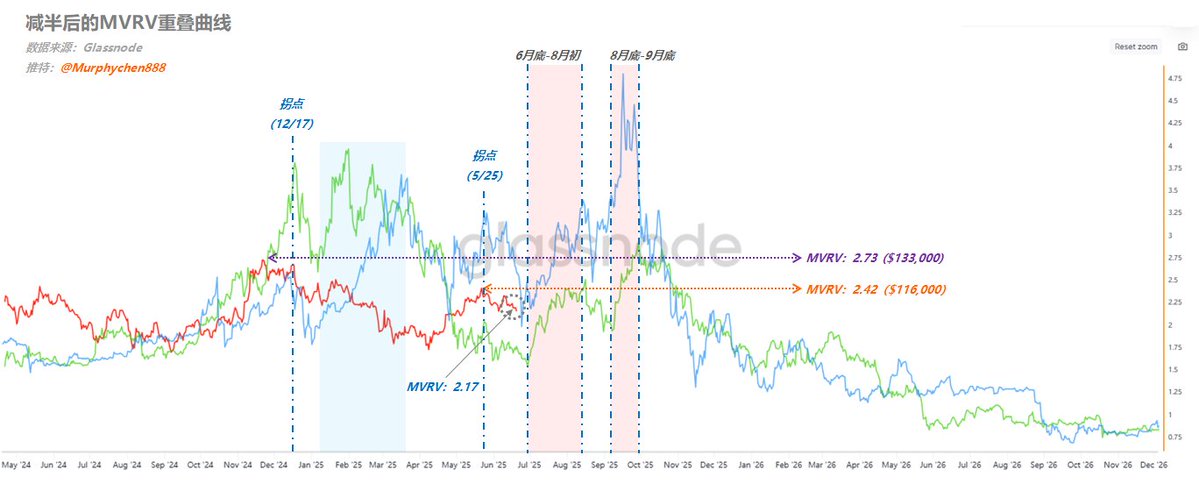
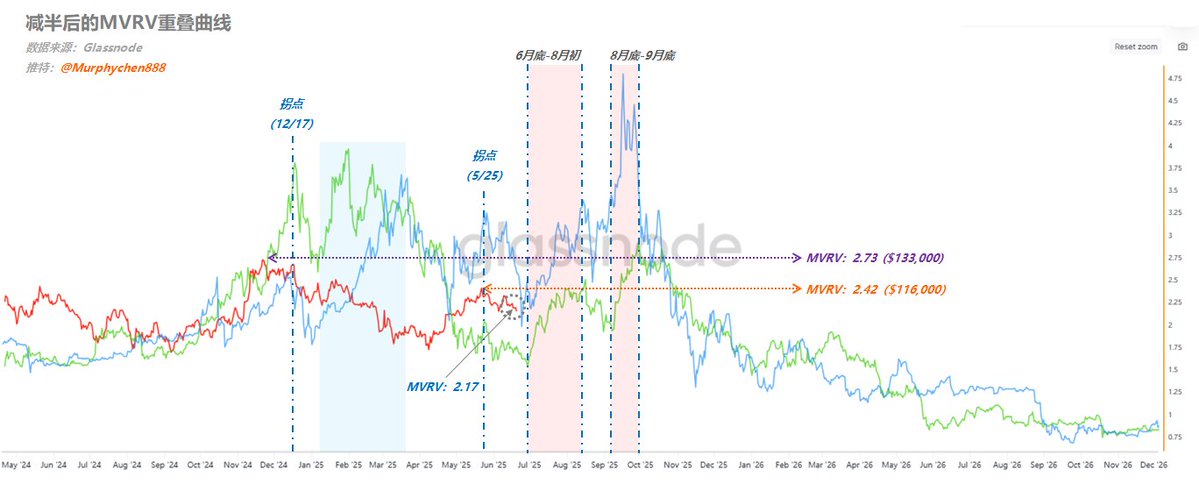
The "three-line convergence" metaphysical indicator shows that there is a possibility for the three MVRV curves to rise synchronously during the two time periods of "late June to early August" or "mid-August to the end of September." However, due to MVRV being consistently under divergence suppression on larger time frames, I have drawn three dashed lines in green, orange, and purple in the chart as references, pointing to the three peaks that appeared in this cycle.
(Chart 1)
Currently, we see that 3 is below 2, and 2 is below 1 (divergent state); if we purely consider it from a metaphysical perspective, I believe there is a chance to see an upward movement to the green or orange line during the above two time periods, corresponding to a BTC price of approximately $112,000 to $116,000.
As for whether it can reach the purple line, it depends on whether it is a "bounce" or a "reversal." I provided a method for judgment in my tweet this morning. Clearly, this is still quite challenging, as in every previous cycle, MVRV has not been able to break through the suppression of large-scale divergence.
In other words, the MVRV of this cycle at 2.73 is the previous high, and it cannot form a breakthrough afterward. Based on the current RP calculation, if it can reach near the purple line, the BTC price will reach $133,000 (of course, the further away the time, the higher this price may be).
‼️ My sharing is for learning and communication purposes only and should not be considered as investment advice ‼️
-------------------------------------------------
This article is sponsored by #Bitget | @Bitget_zh

There’s not much to see during garbage time, so I can only stargaze...🤣
From the "three-line convergence" indicators, there are two periods in the second half of this year where the blue and green lines rise simultaneously, specifically from late June to early August (Period 1) and from mid-August to the end of September (Period 2). If the red line follows the previous patterns, it will also rise in sync. From a purely metaphysical perspective, I believe there may be two variables here:
🚩Variable 1:
After the turning point on May 25, the indicators have remained in a state of oscillating downward; currently, the MVRV is 2.17. To achieve a simultaneous upward movement with the blue and green lines by the end of June, one prerequisite must be met: the MVRV should pull back below 2 before the end of June, which corresponds to a BTC price of $95,000.
If this does not happen, then during the aforementioned "Period 1," the MVRV will likely only rebound close to the previous high, which is MVRV=2.42 (the orange dashed line in the chart), corresponding to a BTC price of $116,000.
🚩Variable 2:
After the turning point on May 25, a situation similar to what occurred after the turning point on December 17 may arise, where from January to March 25, the red line completely diverges from the blue and green lines, moving in the opposite direction (the blue shaded area in the chart).
If this happens, then the entire "Period 1" will be oscillating downward, and only in "Period 2" might there be a chance to rise again in sync; at that time, there may be an opportunity to challenge the highest point of this cycle, MVRV=2.73 (the purple dashed line in the chart), corresponding to a BTC price of $133,000.
---------------------------------------------
Note: Metaphysical predictions are primarily based on mystique; the "corresponding BTC price" mentioned in the text is calculated based on the current RP value, and the longer the time interval, the greater the change in RP value, so it’s best to calibrate every two weeks.
‼️ My sharing is for learning and communication purposes only and should not be considered investment advice ‼️
---------------------------------------------
This article is sponsored by #Bitget | @Bitget_zh

62.53K
160
The content on this page is provided by third parties. Unless otherwise stated, OKX is not the author of the cited article(s) and does not claim any copyright in the materials. The content is provided for informational purposes only and does not represent the views of OKX. It is not intended to be an endorsement of any kind and should not be considered investment advice or a solicitation to buy or sell digital assets. To the extent generative AI is utilized to provide summaries or other information, such AI generated content may be inaccurate or inconsistent. Please read the linked article for more details and information. OKX is not responsible for content hosted on third party sites. Digital asset holdings, including stablecoins and NFTs, involve a high degree of risk and can fluctuate greatly. You should carefully consider whether trading or holding digital assets is suitable for you in light of your financial condition.

