Whether you’re new to crypto trading or a seasoned vet, having the right tools in your trading arsenal is essential. Signal trading in crypto provides a data-driven approach to making decisions on buying or selling. These signals are generated based on market conditions, indicators, and analysis, which can help you navigate and explore digital assets to trade.
Signal trading is ideal for beginners to help them understand different strategies and serves as a second opinion for experts. It can also help traders make rational decisions, minimizing the impact of FOMO (fear of missing out) and providing a more calculated approach to their cryptocurrency trades.
What is signal trading?
With crypto open for business 24/7, keeping your finger on its pulse can be challenging. It can be overwhelming whether you’re scrolling down crypto X (formerly known as Twitter) or juggling multiple tabs of crypto news outlets. But have you thought of signal trading?
Signal trading offers a solution for traders who can’t afford to glue their eyes to fluctuating price changes all day and night. It allows you to quickly capitalize on market movements at an automated speed, reducing the need for constant monitoring. Signals often come with suggested stop-loss levels, serving as a built-in risk management tool.
It can be helpful for those new to crypto trading who may find the complexities of when to enter or exit a trade daunting. Signal trading acts as a guiding hand, offering a more structured approach to decision-making and trading opportunities. But the utility of signal trading isn’t just for beginners — it’s also a resource-efficient strategy for seasoned traders. By following multiple signals covering digital assets, traders can diversify their portfolios.
Automated signals provide a reliable way to adhere to trading strategies, reducing FOMO. This can benefit those incapable of conducting in-depth market analysis, saving time and resources.
Potential drawbacks
Nevertheless, trading signals have potential drawbacks. The signals are only as reliable as the algorithms or analysts that produce them, and an inaccurate signal can lead to financial losses.
While some signal services come free, others require a subscription fee, adding to the cost of trading. As in any market, due diligence is essential — signal trading isn’t immune to bad actors. Excessive trust in indicators could hinder a trader’s growth regarding their capacity to create their own analytical opinions.
Why do trading indicators matter in crypto?
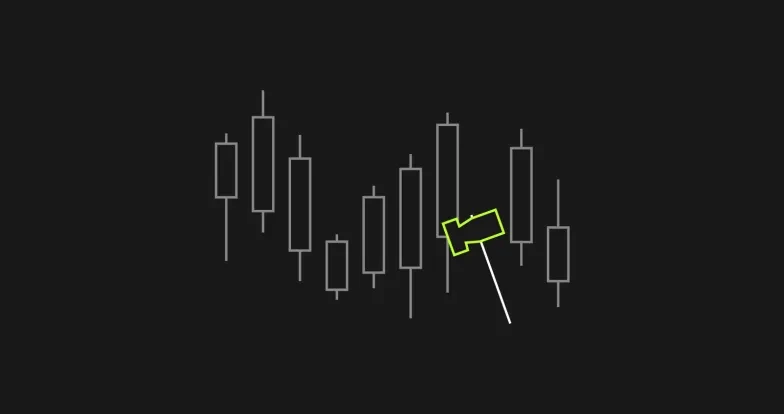
Indicators play a crucial role in cryptocurrency trading, enabling traders to analyze historical and present price data to forecast future price movements. This is especially crucial given the crypto market’s inherent volatility, constant fluctuations, and round-the-clock trading.
Some widely used indicators include the moving average convergence divergence (MACD), relative strength index (RSI), and Bollinger bands, all of which are considered among the best indicators in a trader's toolkit. Using different indicators, traders can confirm trends, decrease the risk of false signals, and improve the probability of successful trades.
Indicators help traders identify optimal entry and exit points. A trader might use the RSI to find “overbought” or “oversold” conditions. An RSI above 70 often indicates a digital asset might be overbought and due for a correction, signaling a potential exit point or a short position.
Meanwhile, an RSI below 30 could suggest that the asset is oversold, serving as a cue to consider buying. Indicators help traders navigate the crypto markets by providing a more structured approach to trading, supporting better decision-making and risk management.
Top 5 crypto trading indicators: A closer look
Moving averages: A line graph that portrays the mean value, serving as a reliable tool in analyzing price action. Its consistency enhances the clarity of overall patterns. In crypto, moving averages effectively signifies whether asset prices are positioned above or below the mean, offering valuable insights into market trends and aiding in interpreting price action dynamics.
Relative strength index (RSI): A fundamental part of technical analysis, the RSI is a number between 0 and 100 that measures the speed and change of price movements, making it a valuable tool for identifying overbought and oversold conditions in both uptrends and downtrends. In crypto trading, an RSI above 70 indicates overbought conditions, while a reading below 30 suggests oversold conditions. These levels provide valuable insights for identifying potential entry and exit points, gauging trend strength and anticipating potential reversals in the market.
Bollinger bands: Bollinger bands are three bands — an upper band, a middle band, and a lower band, plotted based on a moving average and standard deviation. They narrow or widen based on volatility, serving as a valuable volatility indicator. In crypto, they’re used to identify “squeeze”points that often precede large price movements.
On-balance-volume (OBV): This volume indicator tracks buying and selling pressure by adding volume on up days and subtracting it on down days. In crypto, OBV shows trends and points to potential reversals, as a rising OBV typically comes with a rising price.
Moving average convergence divergence: The MACD is a momentum oscillator subtracting a longer-term moving average from a shorter-term moving average. When the MACD line crosses the signal line, it’s a bullish signal. When it’s below, it’s bearish. MACD confirms a trend’s direction and strength in crypto trading, helping traders decide on optimal entry and exit points.
8 more powerful indicators: A quick overview
Ichimoku Cloud: This powerful technical analysis tool in crypto trading offers a comprehensive view of potential price trends by providing key indicators within a single chart. It combines critical indicators into a single chart, providing insights into support, resistance, trend direction, and potential reversals. Traders use it to make informed decisions about when to enter or exit the cryptocurrency market, making it a valuable tool for visually analyzing market conditions and trends.
Exponential moving average (EMA): This technical trading indicator is widely used in cryptocurrency markets. Unlike the Simple Moving Average (SMA), the EMA gives greater weight to recent price data, making it more responsive to current market conditions. As a trend indicator, EMAs also smooths out price fluctuations by calculating the average of a cryptocurrency’s closing prices over a specified period, emphasizing recent prices. This responsiveness makes the EMA a valuable tool for traders seeking to identify short-term trends and potential entry or exit points in the dynamic world of cryptocurrency trading.
Average directional index (ADX): This trend-following indicator, commonly used in cryptocurrency trading, quantifies the strength and momentum of a trend on a scale of 0 to 100, with higher values indicating stronger trends. A rising ADX suggests a strengthening trend, while a falling ADX may indicate a weakening trend or a sideways market.
A/D indicator (accumulation/distribution): This indicator shows how much money goes into or out of an asset by combining price and volume. In crypto, the A/D indicator can help traders predict whether a digital asset is being bought or sold, which can help predict trends.
Fibonacci retracement: This tool uses horizontal lines to show potential support and resistance levels. In crypto, traders use Fibonacci retracement to identify critical levels for entering or exiting trades, especially after significant price moves.
Stochastic oscillator: A momentum indicator that compares an asset’s closing price to its price range over a time period. It’s used in crypto to identify overbought or oversold conditions, which help traders time their entry and exit points more effectively.
Aroon indicator: This indicator can help you tell if a new trend is starting and how strong it is. The Aroon indicator can help you make decisive decisions when a trend changes in crypto markets.
On-chain metrics: On-chain metrics analyze blockchain data such as transaction volume, trading volume, active addresses, and hash rates. These metrics complement technical indicators for a well-rounded trading strategy. How to use multiple crypto trading indicators
By using different technical indicators in crypto trading, traders can improve the accuracy of their trading decisions. Single indicators can be problematic since, for instance, relying solely on moving averages may cause delays in signals, and using only the RSI could create false buy or sell signals.
Traders can use a combination of various indicators to construct a comprehensive trading routine. For instance, one might implement moving averages to determine the trend direction, RSI to assess the market’s momentum, and Bollinger bands to identify volatility and potential reversals. This “convergence” of signals can give traders heightened confidence, allowing them to enter or exit trades with greater assurance.
To suit your trading style, you need to tailor these indicators. A swing trader might use longer-term indicators, while a day trading approach might involve shorter time frames and quicker indicators. This allows swing and day traders to define their risk-reward parameters better, aligning with their trading objectives.
The final word
Signal trading in crypto markets is a data-driven tool for helping new and experienced traders to make decisions. You can use technical indicators like MACD, RSI, and on-chain metrics to more effectively determine market trends, manage risks, and time entry and exit points.
It also serves as a second opinion for seasoned traders and a guiding hand for beginners, reducing emotional decision-making, notably FOMO. However, it’s essential to apply careful due diligence as trading signals are only as reliable as their source. Diversifying your use of indicators and aligning them with your trading style can enhance trading accuracy and confidence.
OKX Signal Trading provides access to high-quality signals and signal bots for those looking to enhance their crypto trading journey further, ensuring you’re well-equipped to seize opportunities and manage risks effectively. Explore OKX signal trading today to take your trading to the next level.
© 2023 OKX. This article may be reproduced or distributed in its entirety, or excerpts of 100 words or less of this article may be used, provided such use is non-commercial. Any reproduction or distribution of the entire article must also prominently state:"This article is © 2023 OKX and is used with permission." Permitted excerpts must cite to the name of the article and include attribution, for example "Article Name, [author name if applicable], © 2023 OKX." No derivative works or other uses of this article are permitted.