Week 20 On-Chain Data: Where Will BTC Go From Here as Agency-Led Bull Market Faces First Test?
Original title: "Cold Thinking under the Fever: From On-chain to Macro Changes, How to Perspective the Cycle and Fate of the Crypto Wave?" |WTR 5.26》
Original source: WTR Research Institute
This week's review
From May 19th to May 26th, the highest rock sugar orange was near $111980, and the lowest was close to $102000, with a fluctuation of about 9.78%. Looking at the chip distribution map, there is a large number of chips traded around about 99000, and there will be some support or pressure.
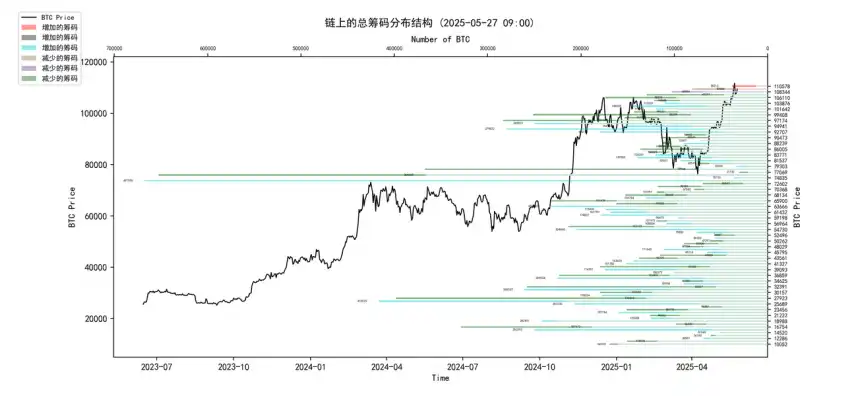
Analysis:
1. 60000-68000 about 1.22 million;
2. 76000-89000 about 1.25 million;
3. 90,000-100,000 about 1.43 million;
• The probability of falling below 95000~100000 in the short term is 80%;
Important news:
Economic news1
. Key Events: Trump's Tariff Policy Volatility and Uncertainty
◦ Description: Trump's tariff policy on the EU has jumped between "imposing 50%" and "extending the 90-day negotiation window until July 9". The fourth round of tariff talks between Japan and the United States is scheduled to be held on the 30th.
2. Fed monetary policy expectations and officials' statements
◦ Divergent rate cut expectations:
▪ Goolsbee: Rate cuts are still likely in the next 10-16 months (dovish). ▪ Bostic: 3-6 months to observe uncertainty (neutral).
▪ Williams: June or July can't be fully figured out (cautiously).
▪ Morgan Stanley: The Fed will not cut interest rates this year, and will start cutting interest rates in March 2026 (hawkish and very different from the mainstream expectations of the market).
◦ Key data: Friday's PCE data is an important basis for the Fed's monetary strategy.
3. Other macro indicators and asset prices
◦ U.S. stock index futures rose (Nasdaq futures 1.5%, S&P 500 1.2%).
◦ The U.S. dollar index fell 0.1%.
◦ Citi raised its gold price target to US$3,500/oz in anticipation of tariff escalation.
◦ U.S. Treasury says sovereign wealth fund plans are on hold.
In terms of
news1. Bitcoin (BTC) Market Performance and Drivers
◦ BTC price recovered to $110,000 (after the Trump tariffs eased).
◦ Coindesk analysts: BTC's all-time high is largely institutional-led, the retail meme boom has subsided, and market sentiment has shifted to more sustainable behavior, potentially paving the way for the long term.
◦ Analyst Eugene Ng Ah Sio: BTC maintains a clear uptrend, and if it is maintained, there is a chance for the copycat market.
◦ Interpretation:
▪ The institutional-led "ongoing narrative": The success of ETFs is one of the core drivers of BTC's current bull run, which is a classic "ongoing narrative".
2. ETF Money Flows (Core "Ongoing Narrative")
◦ U.S. BTC spot ETF inflows of $2.75 billion and ETH spot ETF inflows of about $250 million last week (the highest since early February).
◦ The US BTC spot ETF accumulated a net inflow of $44.499 billion, continuing to hit a record high.
◦ Ryder IBIT has had no net outflows for 30 consecutive days and has net assets of over $71 billion.
3. Corporates and Institutions Increase Their Exposure to BTC (Strengthening the Institutional Narrative)
◦ Bitwise data: In 2025, companies in the U.S. and elsewhere will buy more BTC than triple the new BTC supply.
◦ Semler Scientific increased its holdings by 455 BTC.
◦ Strategy increased its holdings by 4020 BTC last week.
4. Regulatory Dynamics & Industry Conferences (Key Variables Impacting the "Expected Narrative")
◦ The SEC's support for clearer guidance on securities law jurisdictions for events such as PoS/DPoS is seen as positive information for U.S. institutions participating in staking. ◦ Bitcoin 2025 conference (May 27-29), with the participation of the White House head of cryptocurrency and AI, U.S. Senator, and expected Vice President Pence.
◦ Analysis:
▪ "Expected Narrative" of Regulatory Clarity: Peirce's statement is important as it points to a clearer and friendlier regulatory environment, which is critical for the long-term health of the industry, especially in emerging areas such as staking.
Long-term insights: used to observe our long-term situation; Bull/Bear/Structural Change/Neutral
Medium-term Observation: Used to analyze what stage we are currently in, how long it will last in this phase, and what situation we will
faceShort-term observation: Used to analyze short-term market conditions; and the likelihood of some direction and the likelihood
of an event occurring under certain
premisesLong-term insights
• Non-liquid long-term whales
• Total on-chain spot selling pressure
• U.S. ETF for BTC
• Long-term participant position structure by different maturity years
• Large inflow and outflow net positions on trading platforms
•The long-term holder cost line
(non-liquid long-term whales in the chart below)
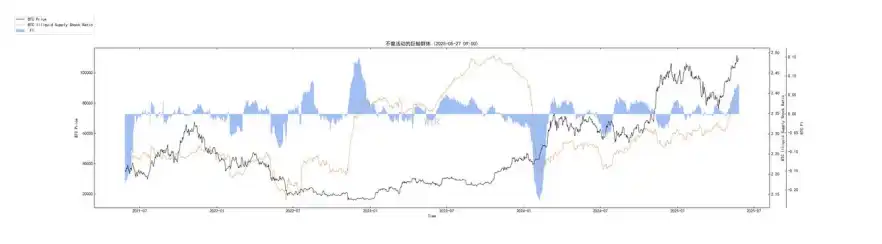
trend has continued since the end of 2023, indicating that these entities are accumulating.
• The overall trend indicates that long-term holders and whales continue to pull BTC out of the liquid market, which constitutes strong supply-side support. The long-term bullish structure remains unchanged, but the new momentum may weaken marginally in the short term.
(The figure below shows the total selling pressure of the spot on the chain)
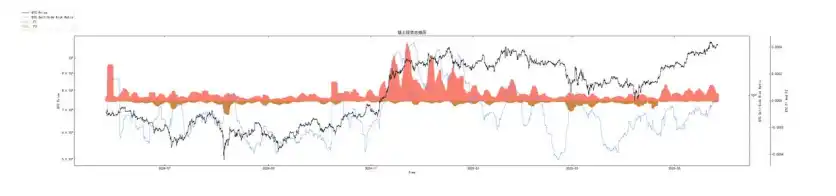
the overall "total selling pressure" of the market has been in a slight upward trend recently. There was a small inflow, but there was a normal rotation of trading activity, not panic selling. From the perspective of "potential selling pressure", there are no worrisome signs of large-scale chip concentration on trading platforms recently, and the market's willingness to sell is not high.
(BTC's US ETFs in the chart below)