$BTC #BTCUSDT
Analysis field: Other varieties can be found in the comments section.
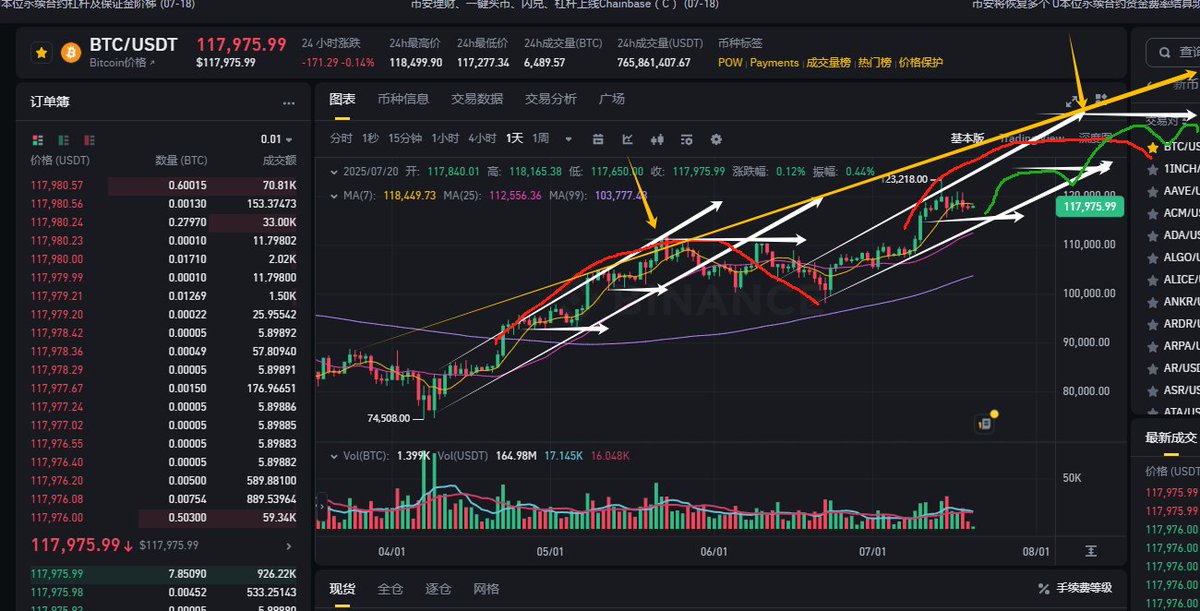
Bitcoin's trend shows a large-scale three-wave fluctuation. The starting point of the first wave was 89,000, with a high of 112,000 and a pullback low of 98,000, resulting in a rise of 25% and a pullback drop of 13%! The second wave's starting line is calculated from 110,300, with the current high at 123,218, showing a rise of 11%. It has been consolidating around 118,000 with a series of small-width doji candles transitioning into a narrow-width volume consolidation! Support has been raised to 115,000, effectively consolidating! Currently, the structure indicates that the second segment's rise in the three-wave fluctuation is not yet complete. It is recommended to buy again above the support level of around 115,000, with effective protection at 110,000; stop-loss if it breaks below! At the beginning of the month, we mentioned in our analysis that Bitcoin would rise to 126,000 this month, and it is currently showing effective movement! The expected price for the second segment of Bitcoin's rise is leaning towards 143,000, and the rise is not over yet! It is recommended to raise the effective protection to 110,000! Maintain a bullish outlook!

Everyone, please don't comment. I'm serializing in the comments section! If you have questions, just reply below the individual serialization to ask and discuss!
Ethereum: $ETH
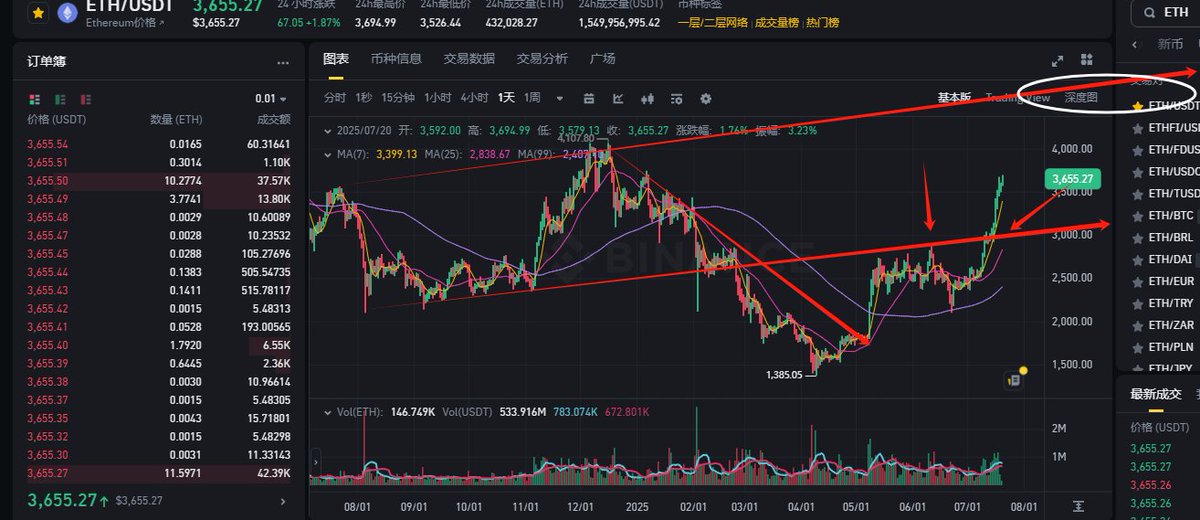
The main upward wave after the daily breakout structure of Ethereum is currently experiencing 8 consecutive bullish days. Tomorrow and next Tuesday will be a test; the 9th and 11th are key nodes for the daily bullish K-line. Simply from the daily structure, a pullback bearish candle is needed to adjust the rise!
The daily strong resistance for Ethereum is at 4300; breaking through 4300 opens up unlimited space! The 3800-4300 range is a watershed for a major market trend! Support has been raised to a major level of 3200.
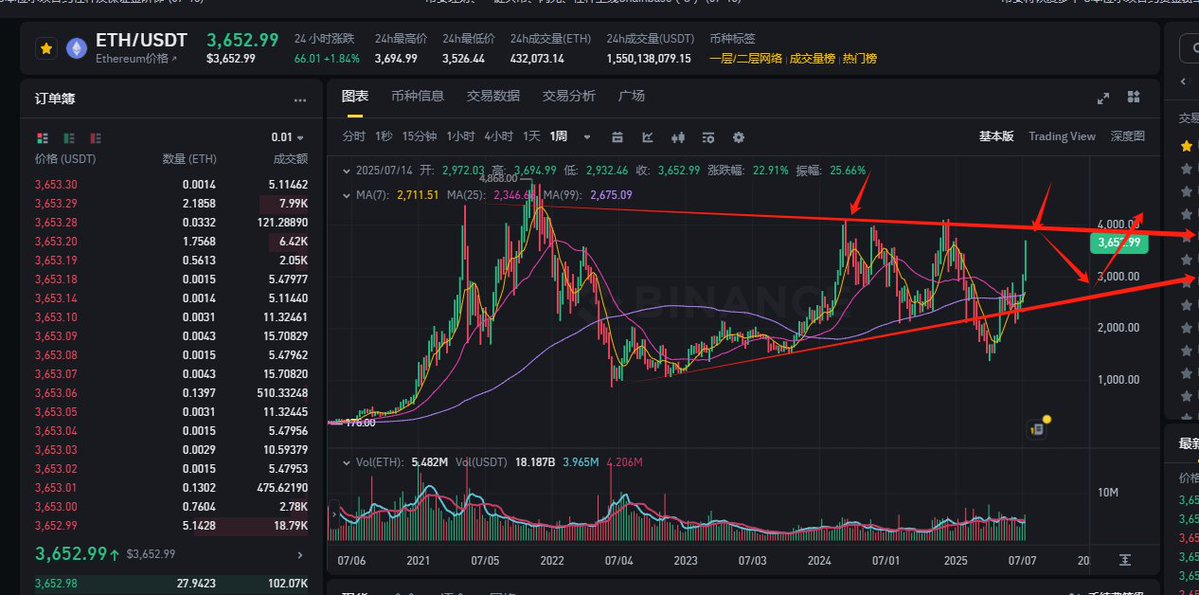
Weekly structure: It is basically close to the pressure trend line now, with a giant bullish candle consuming the deep correction. The weekly chart is in a large wide triangular consolidation. If the weekly chart cannot effectively break and stabilize above 3900 next week, there is a potential for a significant downward movement after touching the previous high, driven by the momentum of the large wide triangular consolidation! In summary, Ethereum is approaching the pressure zone; it is advised not to FOMO near the pressure zone to cool down emotions. Even if it breaks through 4300, chasing it is safer than chasing at 3800! Because it has completely detached from the low area!
Of course, my Ethereum position is around 3300, and I will basically be washed out. My average cost is around 2000! I only have 90 left in my spot position, and I will continue to hold these 90, after all, the large position with leverage has already been washed out with 1500 Ethereum!


30.58K
10
The content on this page is provided by third parties. Unless otherwise stated, OKX is not the author of the cited article(s) and does not claim any copyright in the materials. The content is provided for informational purposes only and does not represent the views of OKX. It is not intended to be an endorsement of any kind and should not be considered investment advice or a solicitation to buy or sell digital assets. To the extent generative AI is utilized to provide summaries or other information, such AI generated content may be inaccurate or inconsistent. Please read the linked article for more details and information. OKX is not responsible for content hosted on third party sites. Digital asset holdings, including stablecoins and NFTs, involve a high degree of risk and can fluctuate greatly. You should carefully consider whether trading or holding digital assets is suitable for you in light of your financial condition.

