What are the reference dimensions of the market's long-term and short-term price movements?

source: Now
many people seem to be staring at the market price every day, especially the partners of the full warehouse altcoins, some people are considering whether to return to the original withdrawal, and some people are still looking forward to the return to the original ......
Most of the comments received in the background recently are questions about the price and what to buy, such as someone asking: Can Bitcoin really rise to $150,000 next? My Ethereum cost is $3,800, do I still have a chance to pay back? I heard that the cottage season is coming, what coins are better to buy now, do you have any recommendations? Wait a minute.
I took a brief look at the user information in the background of the official account, and most of the above questions were raised by new friends who paid attention to Li Yanwai for a short time, perhaps because these new partners still have no bottom on their own investment matters, so they will directly base their hopes of whether they can make money (or return to capital) on the views or suggestions that others can give.
At the same time, I also found another interesting phenomenon, since last month (April) the phased new market started again, the average number of people who close the customs per day is greater than the number of new followers, that is, in the past 1 month or so, the total number of followers in the background has not only not increased, but has decreased slightly.
However, I think it's good that everyone should make their own choices and reduce the interference of others in their investment strategy. And to be honest, Li Huawai always insists on the output of the long picture and text type, which may not be suitable for everyone's attention, after all, in the context of this massive amount of information, there are relatively few people who can still calm down and keep patience to spend time reading long articles, some like to eat fast food, some people like to eat Chinese food, this is just a matter of choice. We will continue to maintain the output of Buddhism, and everyone can pay attention to it.
In fact, learning is often a process from more to less, for example, many people will often pay attention to dozens, or even hundreds of bloggers at the beginning, or join a dozen, or even dozens of different circles, and then as they slowly form and establish a set of investment strategies or methodologies suitable for themselves, they may choose to start filtering and shielding most of the interference of invalid information, and withdraw from most of the circles, so as to further maintain better personal thinking and concentration.
In short, each person's background, experience, and risk tolerance are very different, and each person's thinking model, knowledge experience, observation angle, and interest appeal are also different. Different angles may result in different results, therefore, many problems do not need to be right and wrong, different people should make different choices, only what suits them is the best. Especially in the field of investment, we should not always fantasize about pursuing the kind of general, lazy and profitable money-making model, the real money-making model has a certain threshold, such as capital threshold, time threshold, cognitive threshold, and so on.
In the previous article (May 12), we mainly talked about some of the macro factors that affect the market. But as far as the market situation is concerned, some people like to pay attention to macro factors, and some people like to pay attention to some data or indicators, so we might as well make some enumerations for the data/indicator latitude:
for example, we can pay attention to the changes in the funding rates, as shown in the figure below.

Because with the recent recovery in the market, there will be more bullish traders in the market, and they are willing to pay fees to the bears, so we can keep an eye on short-term market trends by observing changes in the funding rate.
For example, we can also look at the changes in Open Interest, as shown in the chart below.

Open interest can be used as an observation dimension of trading activity, and we can observe whether traders are still interested in trading in the short term by changing the range maintained by open interest.
As another example, we can look at the changes in Stablecoin Inflows, as shown in the chart below.

there is no significant outflow (negative inflow), then it may mean that traders are still rotating funds between projects without worrying about short-term market fluctuations.
Alternatively, we can also judge market changes by the changes in the trading volume of CEXs and DEXs, and see if there has been an increase in DEX trading volume recently, which usually means that the current market is in high demand and has strong upward momentum. This is shown in the figure below.

short, different risk appetites will correspond to different investment styles, and different investment styles will have a variety of different information or data dimensions that can be used as auxiliary references, and at the same time, they are divided into long-term, medium- and short-term investment perspectives.
The funding rate, open interest, stablecoin inflow, etc. mentioned above can be used as a reference for the short- and medium-term dimensions, in addition, you can also record and summarize many other dimensions of reference by yourself, such as the ETH/BTC ratio, BTC. D、USDT. D, Fear & Greed Index, Altseason Index, Speculative Sentiment Index...... Wait a minute.
If you are more interested in the long-term indicators of Bitcoin, then you can also directly use the "Bitcoin Indicator Template Table" that we have compiled in our previous article, in which we have collected and sorted out more than 35 comprehensive indicator data to observe and assist in guiding the long-term trading of Bitcoin. This is shown in the figure below.

Of course, most people may prefer to directly guide their trading through candlesticks, and there is no problem with this, including some basic knowledge of candlesticks in our previous articles. If you are interested in this, you can continue to search and review the historical articles outside the words.
Here we take BTC as an example to take a brief look at the candlestick market:
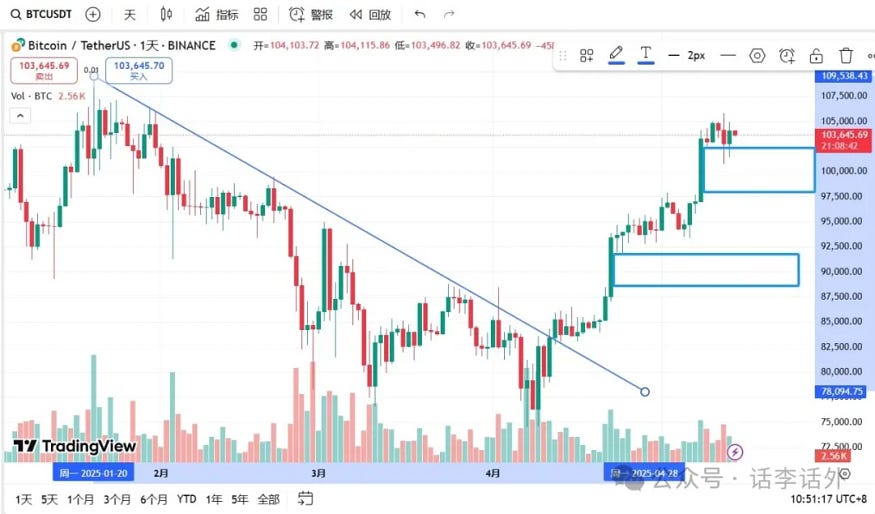
from the weekly level, the MACD has crossed, showing a relatively good upward trend, and the current Bitcoin is also trying to hit the all-time high. Combined with the current overall market sentiment, it is possible that Bitcoin will enter a sideways trend after hitting or breaking through new all-time highs in the short term, while BTC. D is likely to continue to decline. However, the weekly level still forms an FVG gap (the red box I marked in the chart below), and it is necessary to pay attention to the $93,000 position, but it seems that the probability of falling to the next FVG level (i.e. around $80,000) in the short term is relatively low. This is shown in the figure below.

Let's continue to look at the 4-hour level, the $98,000 is a position to watch, but if it pulls back to this level, it looks like there is a high probability that there will be another rebound, and then it is near the $93,000 level, and it is not ruled out that these two positions will be covered. This is shown in the figure below.
In the same way, if you are more concerned about the short-term price of ETH, then you can also refer to the above method to make your own judgment, the current ETH looks like $2700-2900 is a resistance range, and this range may also be accompanied by relatively large selling pressure (there should be a lot of hedging before this position), if it goes down, the short-term position that needs to be paid attention to will look near $2200.
However, it needs to be reminded again that although we briefly talked about the K-line market above, it is only a discussion and reference on the idea, not investment guidance or advice, the short-term market is unpredictable, and you need to make your own judgment according to your own risk appetite and position.
In fact, as far as I am concerned, in addition to the need to write articles on a daily basis, it is good to look at the K-line, and it is just a simple look at the weekly level, I am not very suitable for being a trader/analyst, nor is I very suitable for short-term trading, being a simple person and doing simple things is my current pursuit.
So, what are your own pursuits? What trading style do you belong to? Do you have any long-term or short-term reference dimensions to guide your trading?