4 BTC charts/indicators that I’m going to be watching over the next 12 months so I can sell my alts and go full blown maxi 🟧
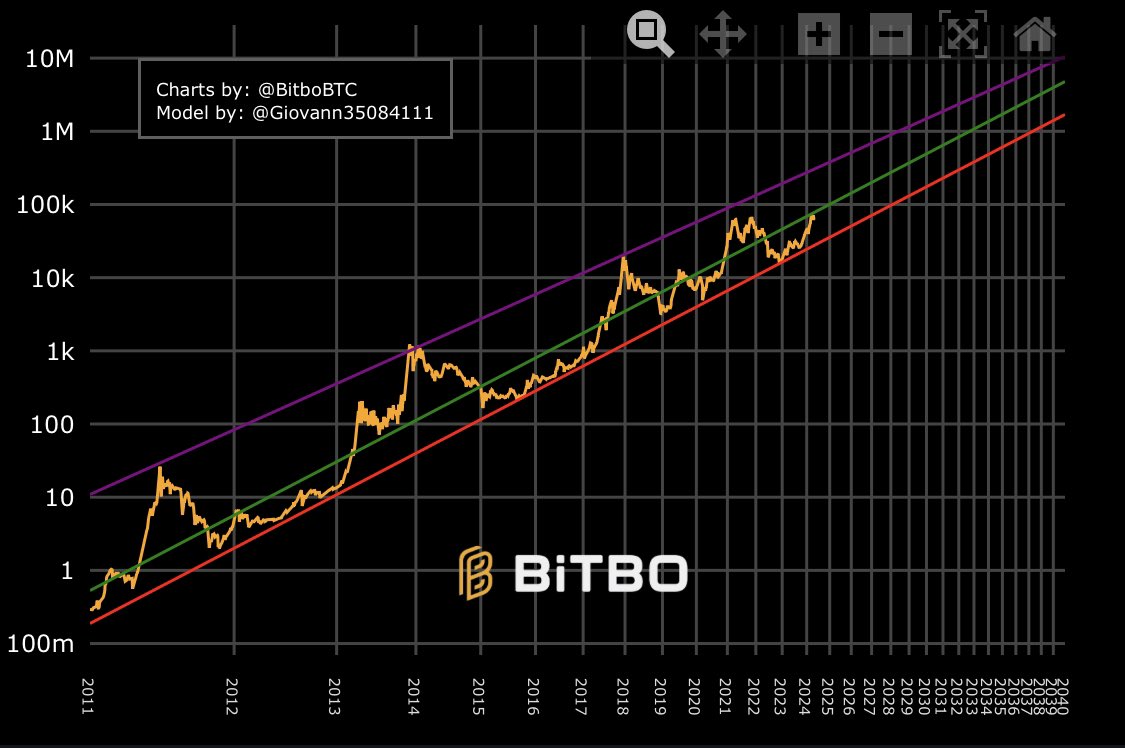
1. Power Law (@Giovann35084111)
This chart uses a Bitcoin "power law" to set two key lines—resistance above today's price and support below, mirroring historical price trends to suggest future highs and lows. It predicts:
1 . Bitcoin may hit $100,000 between 2021-2028, staying above that after 2028.
2. Bitcoin could reach $1,000,000 between 2028-2037, never dropping below that post-2037.
These forecasts rely on past trends indicating the future, though unexpected events could change outcomes. Remember, these predictions are not guaranteed.
Show original
1.31K
457.8K
The content on this page is provided by third parties. Unless otherwise stated, OKX is not the author of the cited article(s) and does not claim any copyright in the materials. The content is provided for informational purposes only and does not represent the views of OKX. It is not intended to be an endorsement of any kind and should not be considered investment advice or a solicitation to buy or sell digital assets. To the extent generative AI is utilized to provide summaries or other information, such AI generated content may be inaccurate or inconsistent. Please read the linked article for more details and information. OKX is not responsible for content hosted on third party sites. Digital asset holdings, including stablecoins and NFTs, involve a high degree of risk and can fluctuate greatly. You should carefully consider whether trading or holding digital assets is suitable for you in light of your financial condition.

